The Owl Solutions
AI-powered carbon footprint tracker
- Industry
- Ecotech
- My role
- Experience Consultant / Lead Designer
- Year
- 2023
The Owl Solutions
AI-powered carbon footprint tracker
Industry
Ecotech
My role
Experience Consultant / Lead Designer
Year
2023
About the company
Owl Solutions is a Canadian tech company that provides data analytics tools to help businesses improve supply chain performance by identifying and eliminating inefficiencies.
Challenge
Their customers struggled with fragmented, manual packaging data, making it hard to measure footprints, control costs, and stay compliant—resulting in poor visibility, slow decisions, and missed sustainability and savings opportunities.
Solution
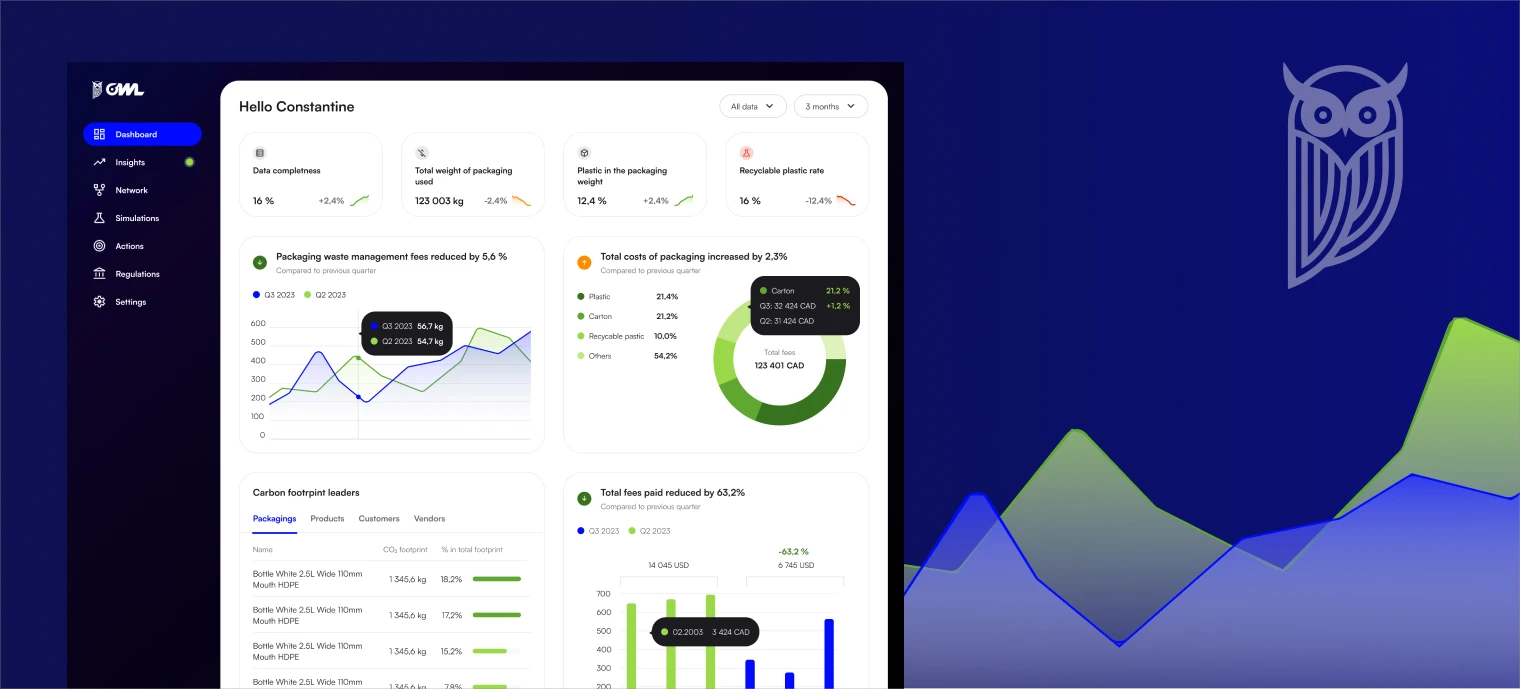
The goal was a dashboard that let businesses quantify and reduce their packaging footprint — capturing supplier data, assessing packaging-related costs and taxes, simulating sustainability trade-offs, and streamlining compliance, all while improving the quality of their supply-chain data.
Discovery & Research
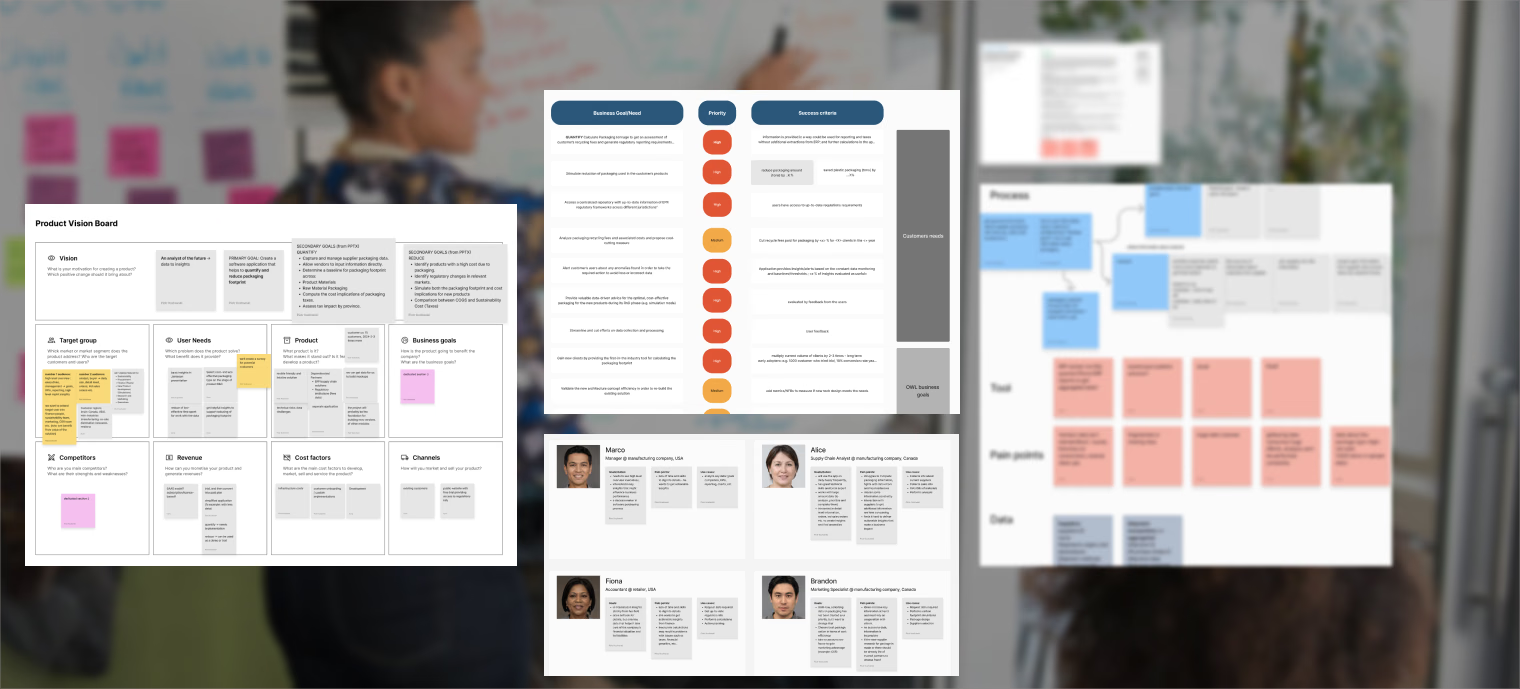
I ran in-depth workshops and interviews with supply-chain analysts, sustainability officers, and finance professionals — from current and prospective clients alike — and mapped the pain points across their packaging-data workflows so the solution answered real needs.
Data Mapping & Prototyping
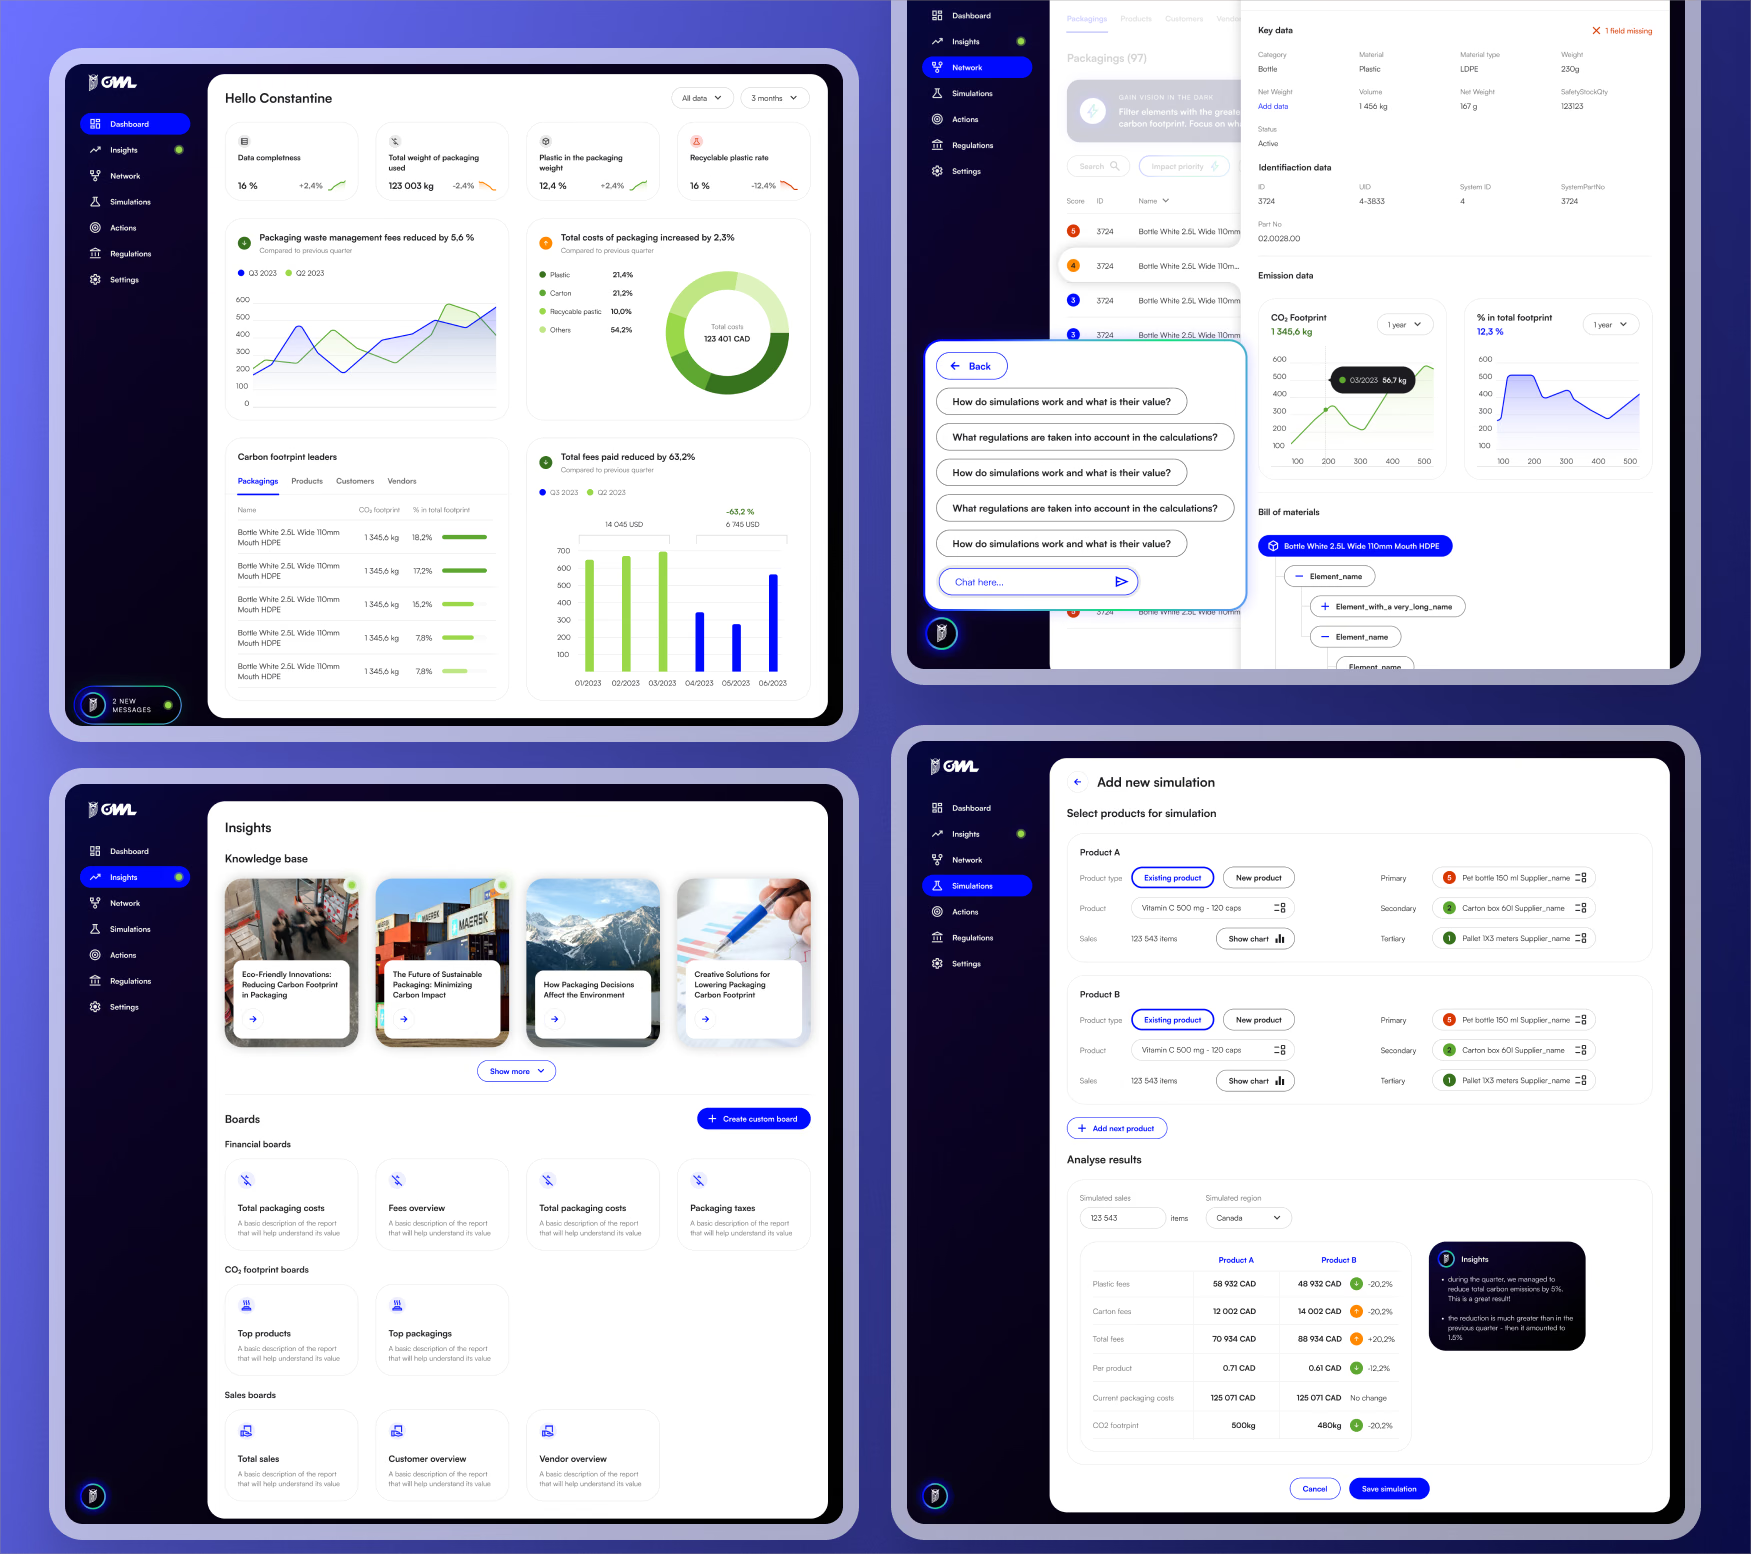
The real design tension was structural: packaging hierarchies are genuinely complex — multi-level components, region-specific regulations — and the dashboard still had to stay usable. I co-created the data architecture with domain experts to hold that complexity, and validated lo-fi prototypes with early adopters to set the interface and feature priorities.
Conceptual User Interface
Highlights
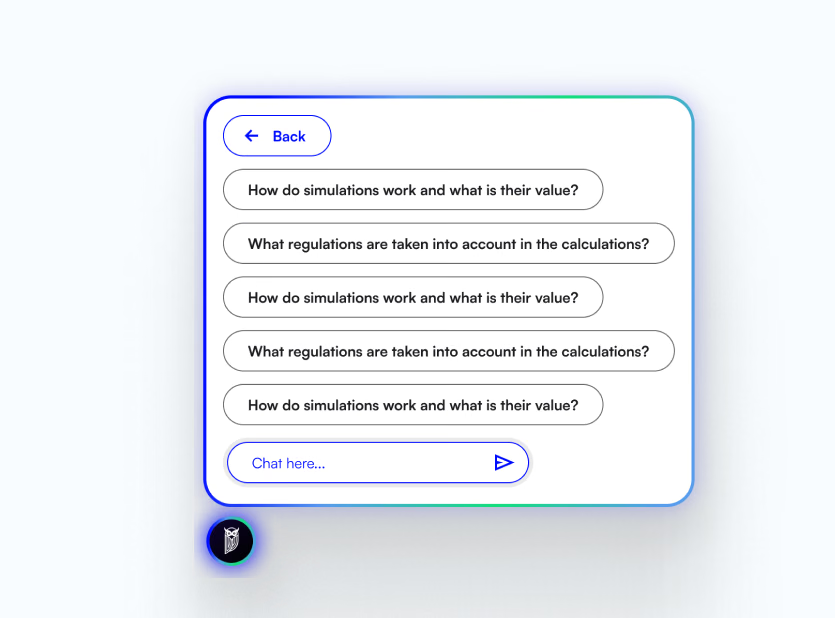
Al Chatbot that offers immediate assistance by answering complex questions about simulation value, regulations, and calculations
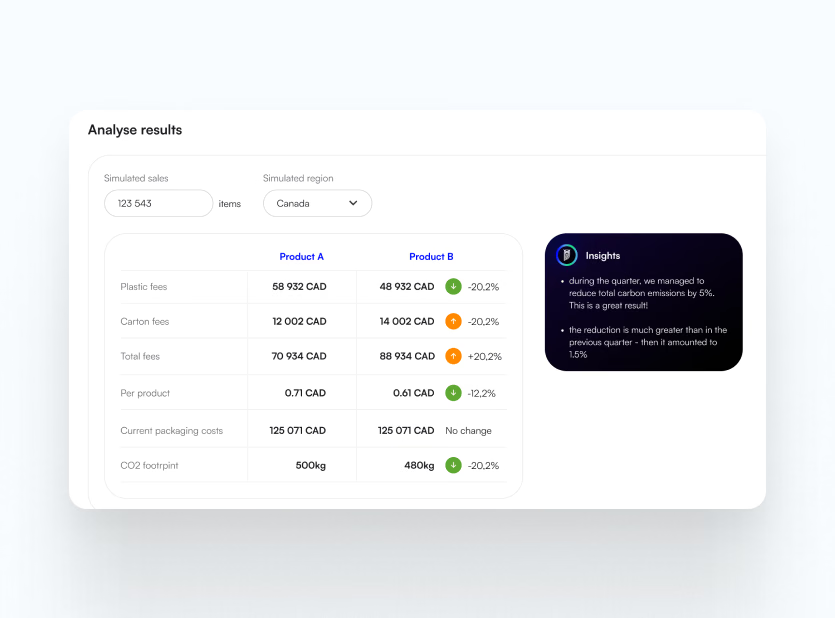
Al providing insights on the percentage change to guide better decisions
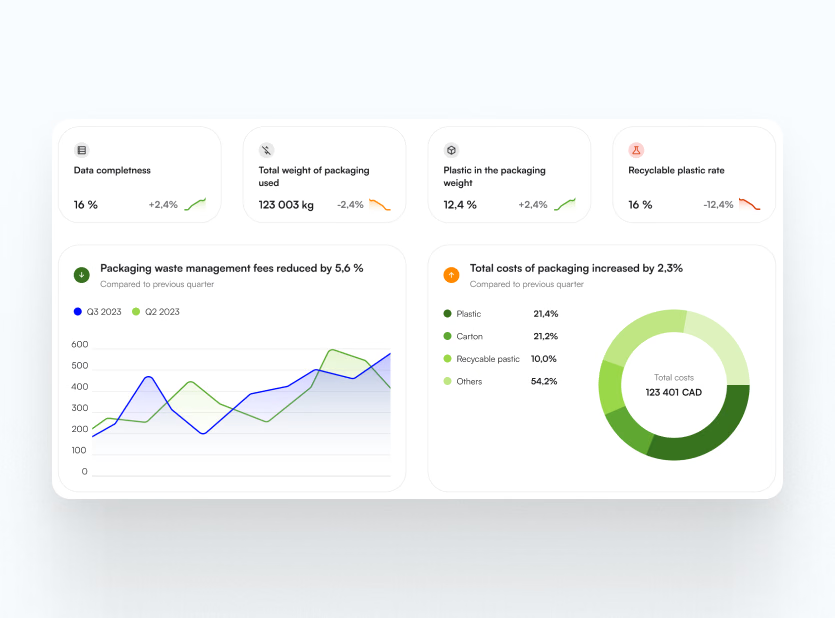
Al-driven metrics to calculate and track key environmental data
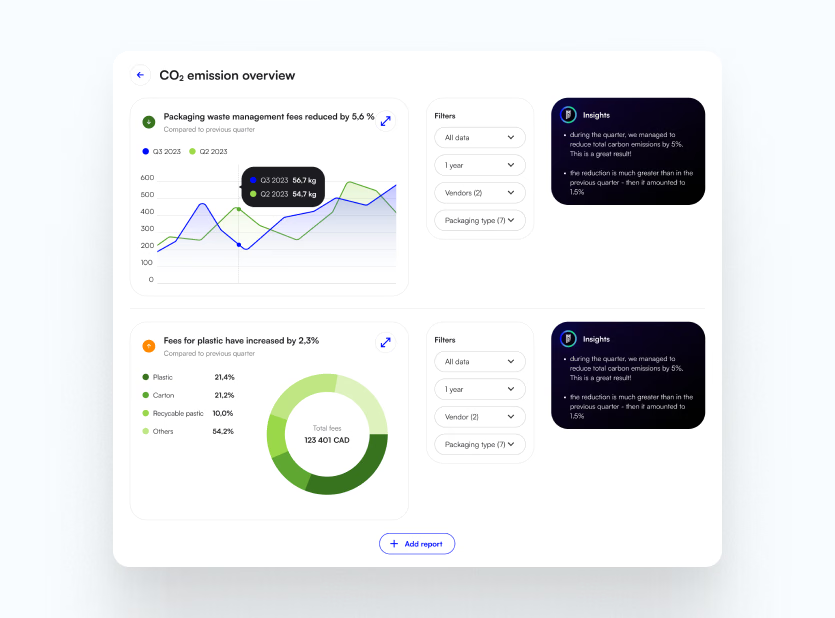
Al-generated actionable "Insights" based on filtered data
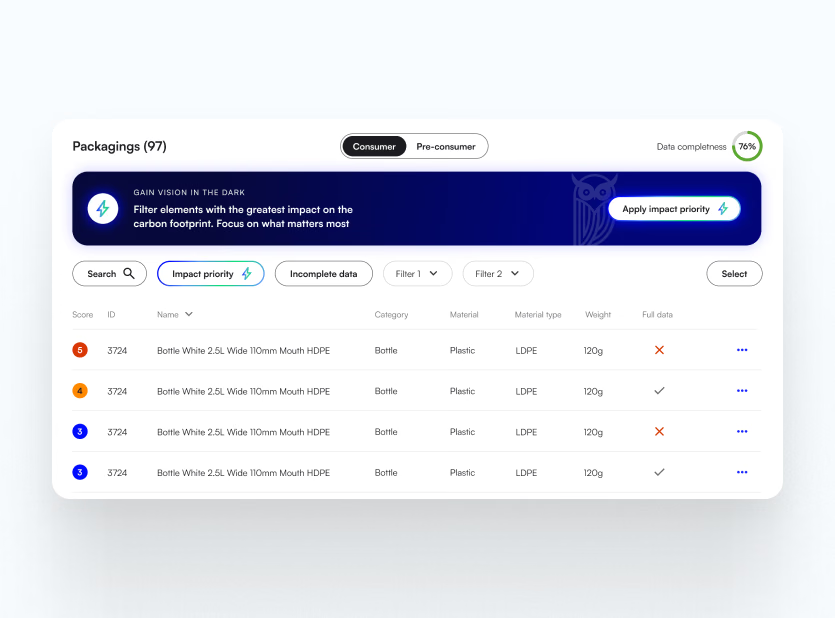
Al-powered "Impact Priority" filter to help users focus on packaging elements that have the greatest impact on the carbon footprint
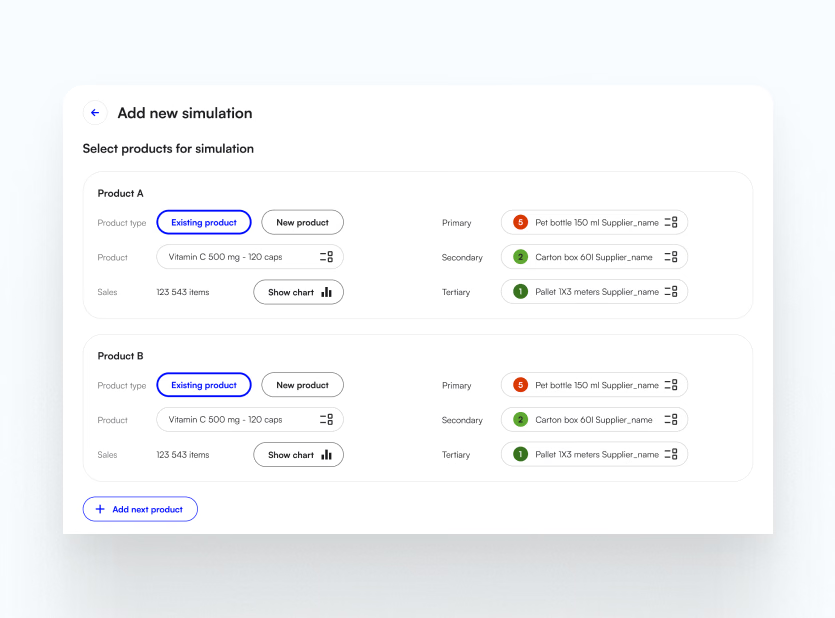
Product scenarios by selecting existing or new products and their primary/secondary/tertiary packaging, leveraging historical sales data for accurate prediction modeling
MVP Definition & Roadmapping
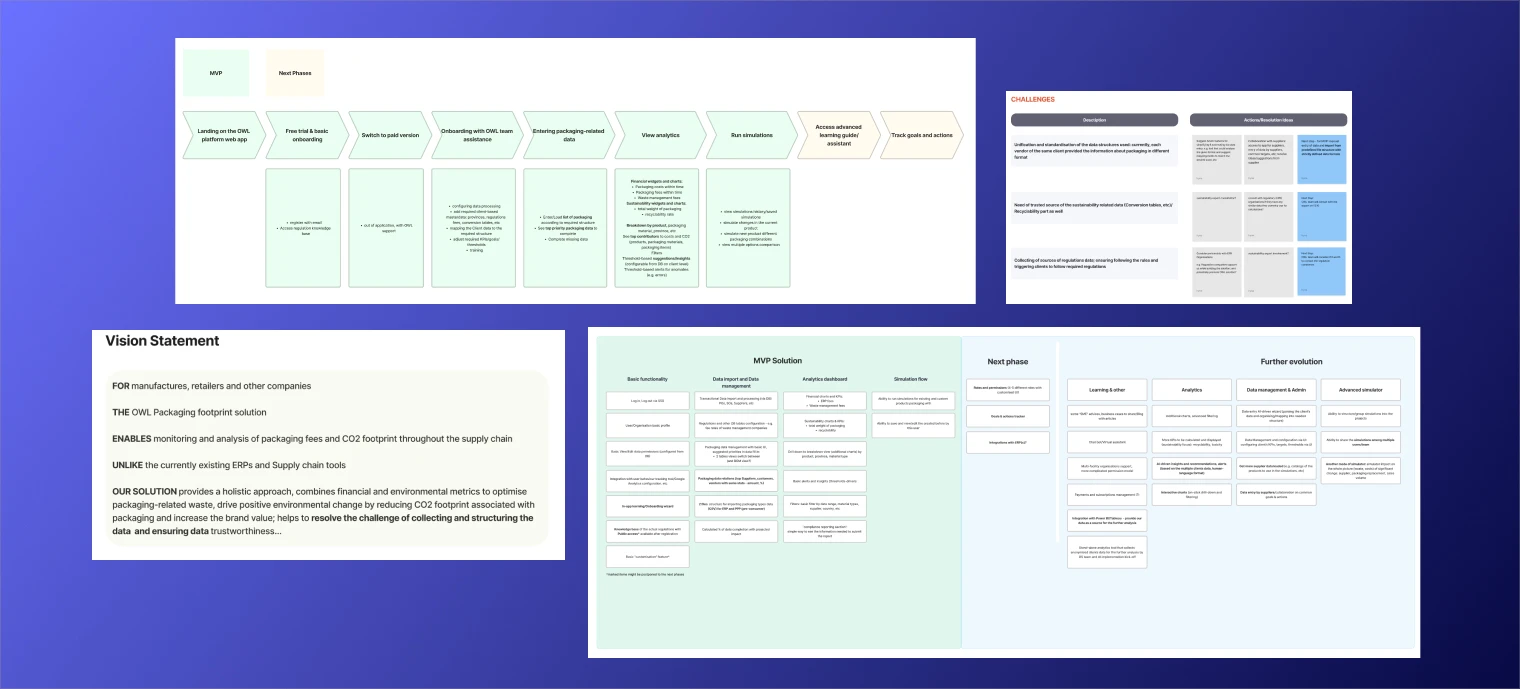
The discipline was scope. I anchored the MVP on quick wins — data import, analytics dashboard, packaging simulations, compliance calculators — and pushed the advanced modules (AI insights, supplier collaboration, deeper metrics like recyclability and toxicity) onto the roadmap rather than into version one.
Outcomes
Automating data collection and enabling real-time analytics, the platform helped supply chain analysts shift from manual processing to high-value decision-making.
Confirmed strong market demand for a tool that bridges packaging data, regulatory compliance, and sustainability insights
Current-state processes were documented in detail, exposing major bottlenecks in data collection, analysis, and reporting. These insights informed the to-be journey and architecture design
Insights from discovery helped shape a modular roadmap—starting with packaging analytics and simulation, with future-ready pathways for deeper AI, supplier collaboration, and expanded compliance coverage.
The Owl Solutions
AI-powered carbon footprint tracker
Industry
Ecotech
My role
Experience Consultant / Lead Designer
Year
2023
About the company
Owl Solutions is a Canadian tech company that provides data analytics tools to help businesses improve supply chain performance by identifying and eliminating inefficiencies.
Challenge
Their customers struggled with fragmented, manual packaging data, making it hard to measure footprints, control costs, and stay compliant—resulting in poor visibility, slow decisions, and missed sustainability and savings opportunities.
Solution
The goal was a dashboard that let businesses quantify and reduce their packaging footprint — capturing supplier data, assessing packaging-related costs and taxes, simulating sustainability trade-offs, and streamlining compliance, all while improving the quality of their supply-chain data.
Discovery & Research
I ran in-depth workshops and interviews with supply-chain analysts, sustainability officers, and finance professionals — from current and prospective clients alike — and mapped the pain points across their packaging-data workflows so the solution answered real needs.
Data Mapping & Prototyping
The real design tension was structural: packaging hierarchies are genuinely complex — multi-level components, region-specific regulations — and the dashboard still had to stay usable. I co-created the data architecture with domain experts to hold that complexity, and validated lo-fi prototypes with early adopters to set the interface and feature priorities.
Conceptual User Interface
Highlights
Al Chatbot that offers immediate assistance by answering complex questions about simulation value, regulations, and calculations
Al providing insights on the percentage change to guide better decisions
Al-driven metrics to calculate and track key environmental data
Al-generated actionable "Insights" based on filtered data
Al-powered "Impact Priority" filter to help users focus on packaging elements that have the greatest impact on the carbon footprint
Product scenarios by selecting existing or new products and their primary/secondary/tertiary packaging, leveraging historical sales data for accurate prediction modeling
MVP Definition & Roadmapping
The discipline was scope. I anchored the MVP on quick wins — data import, analytics dashboard, packaging simulations, compliance calculators — and pushed the advanced modules (AI insights, supplier collaboration, deeper metrics like recyclability and toxicity) onto the roadmap rather than into version one.
Outcomes
Automating data collection and enabling real-time analytics, the platform helped supply chain analysts shift from manual processing to high-value decision-making.
Confirmed strong market demand for a tool that bridges packaging data, regulatory compliance, and sustainability insights
Current-state processes were documented in detail, exposing major bottlenecks in data collection, analysis, and reporting. These insights informed the to-be journey and architecture design
Insights from discovery helped shape a modular roadmap—starting with packaging analytics and simulation, with future-ready pathways for deeper AI, supplier collaboration, and expanded compliance coverage.