Scale Studio
Portfolio intelligence for an early-stage VC fund
- Industry
- Venture Capital
- My role
- Lead Product Designer
- Year
- 2025—2026
Scale Studio Portfolio intelligence for an early-stage VC fund
Industry
Venture Capital
My role
Lead Product Designer
Year
2025—2026
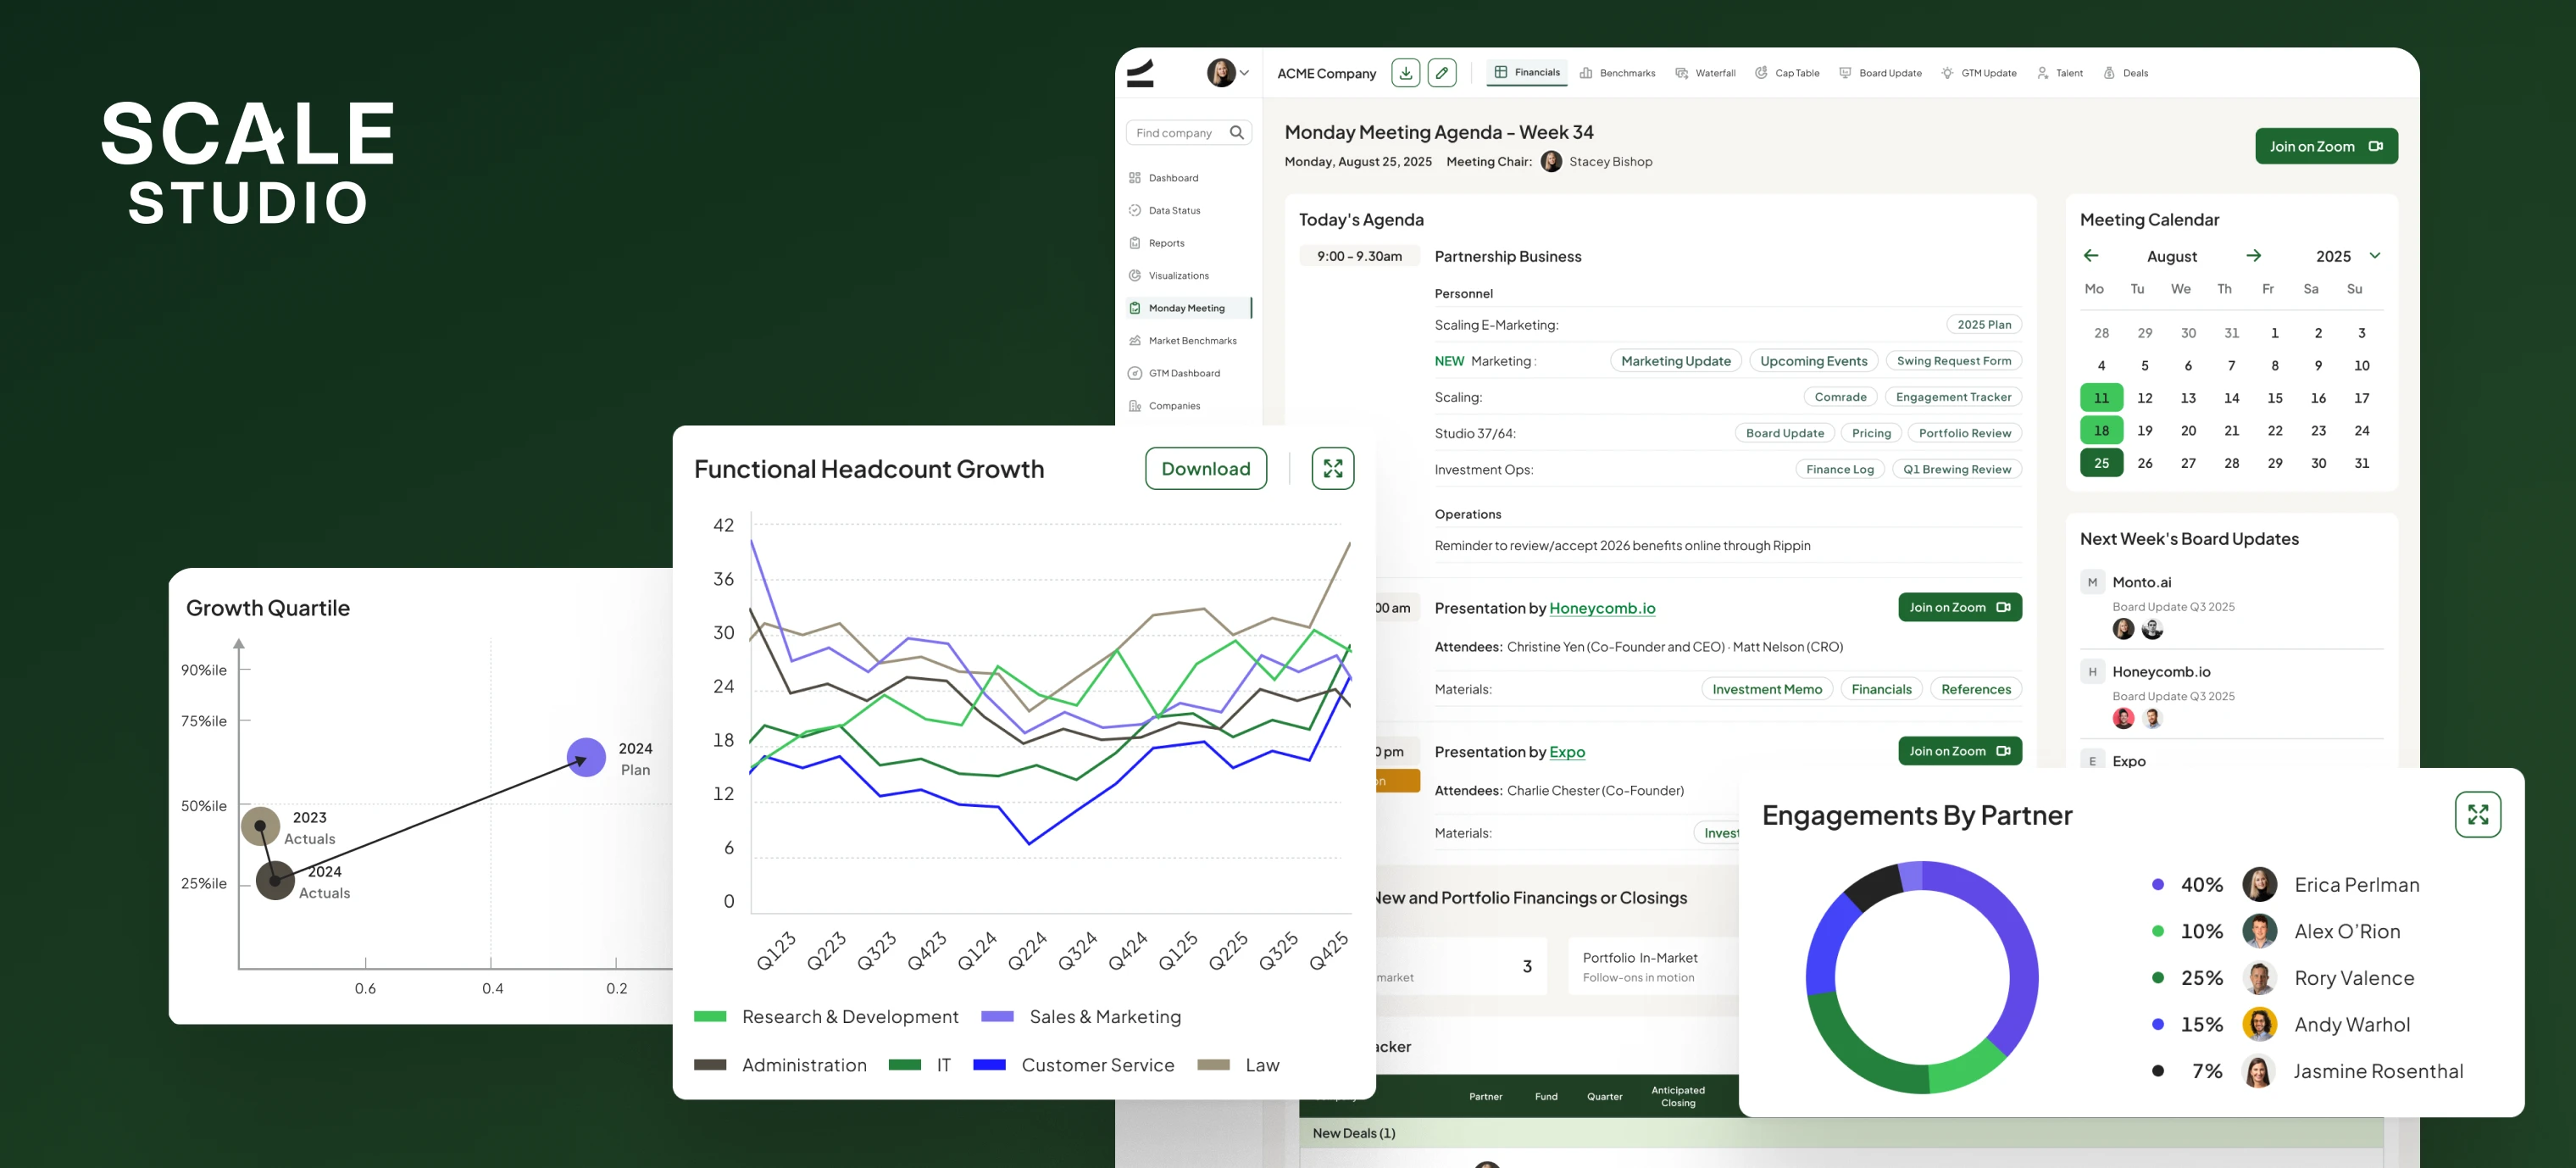
About the company
Scale Venture Partners is an early-stage venture capital firm focused on AI and B2B software, leading most of its Series A and B rounds out of a $900M fund.
Challenge
A fund that leads eighty percent of its checks lives or dies by how fast it can read its own portfolio. At Scale Venture Partners that picture was scattered across spreadsheets, board decks, and inboxes, so every quarterly review started by rebuilding the same numbers by hand. They needed one place where financials, cap tables, and return models stayed current between meetings — not only right before them.
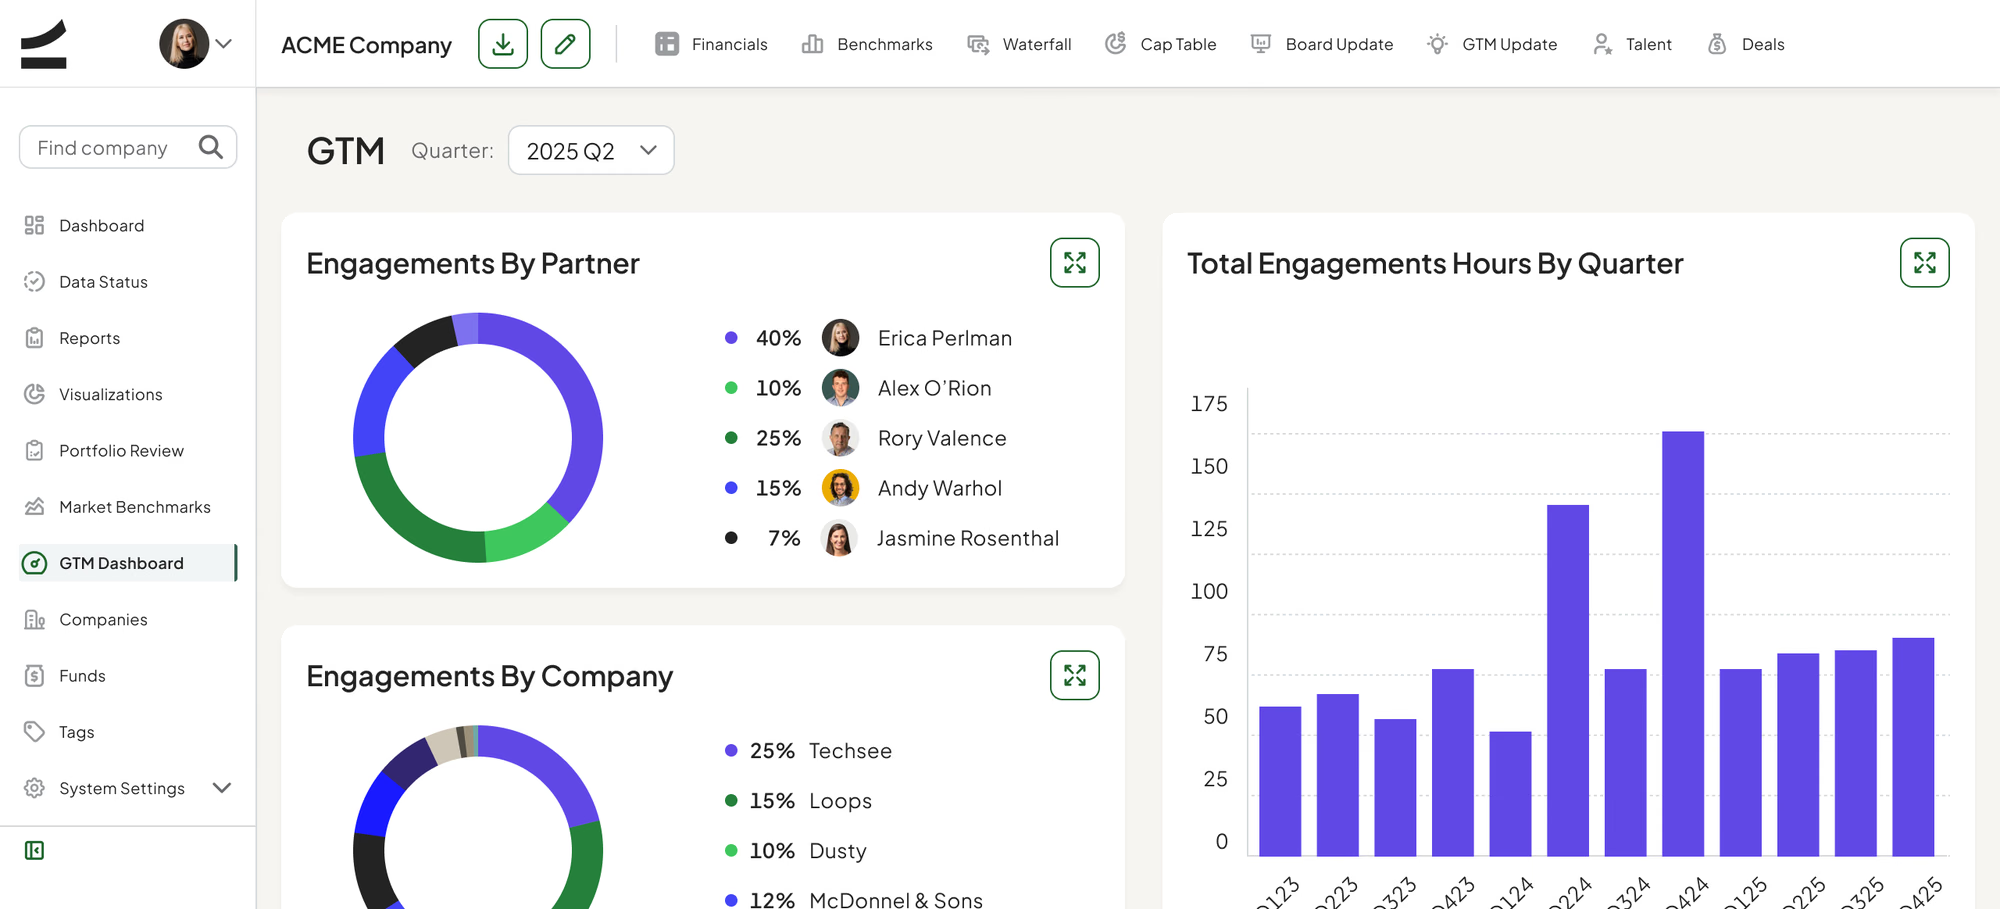
PHASE 1: I designed around the fund’s calendar, not its org chart
I started from the rhythm the firm already ran on — the quarterly close, the Monday meeting, the board update — and mapped which numbers each ritual needed and who touched them first. That sequence became the information architecture. Dashboard, Data Status, Portfolio Review and Monday Meeting Agenda are not modules; they are the four moments in a quarter.
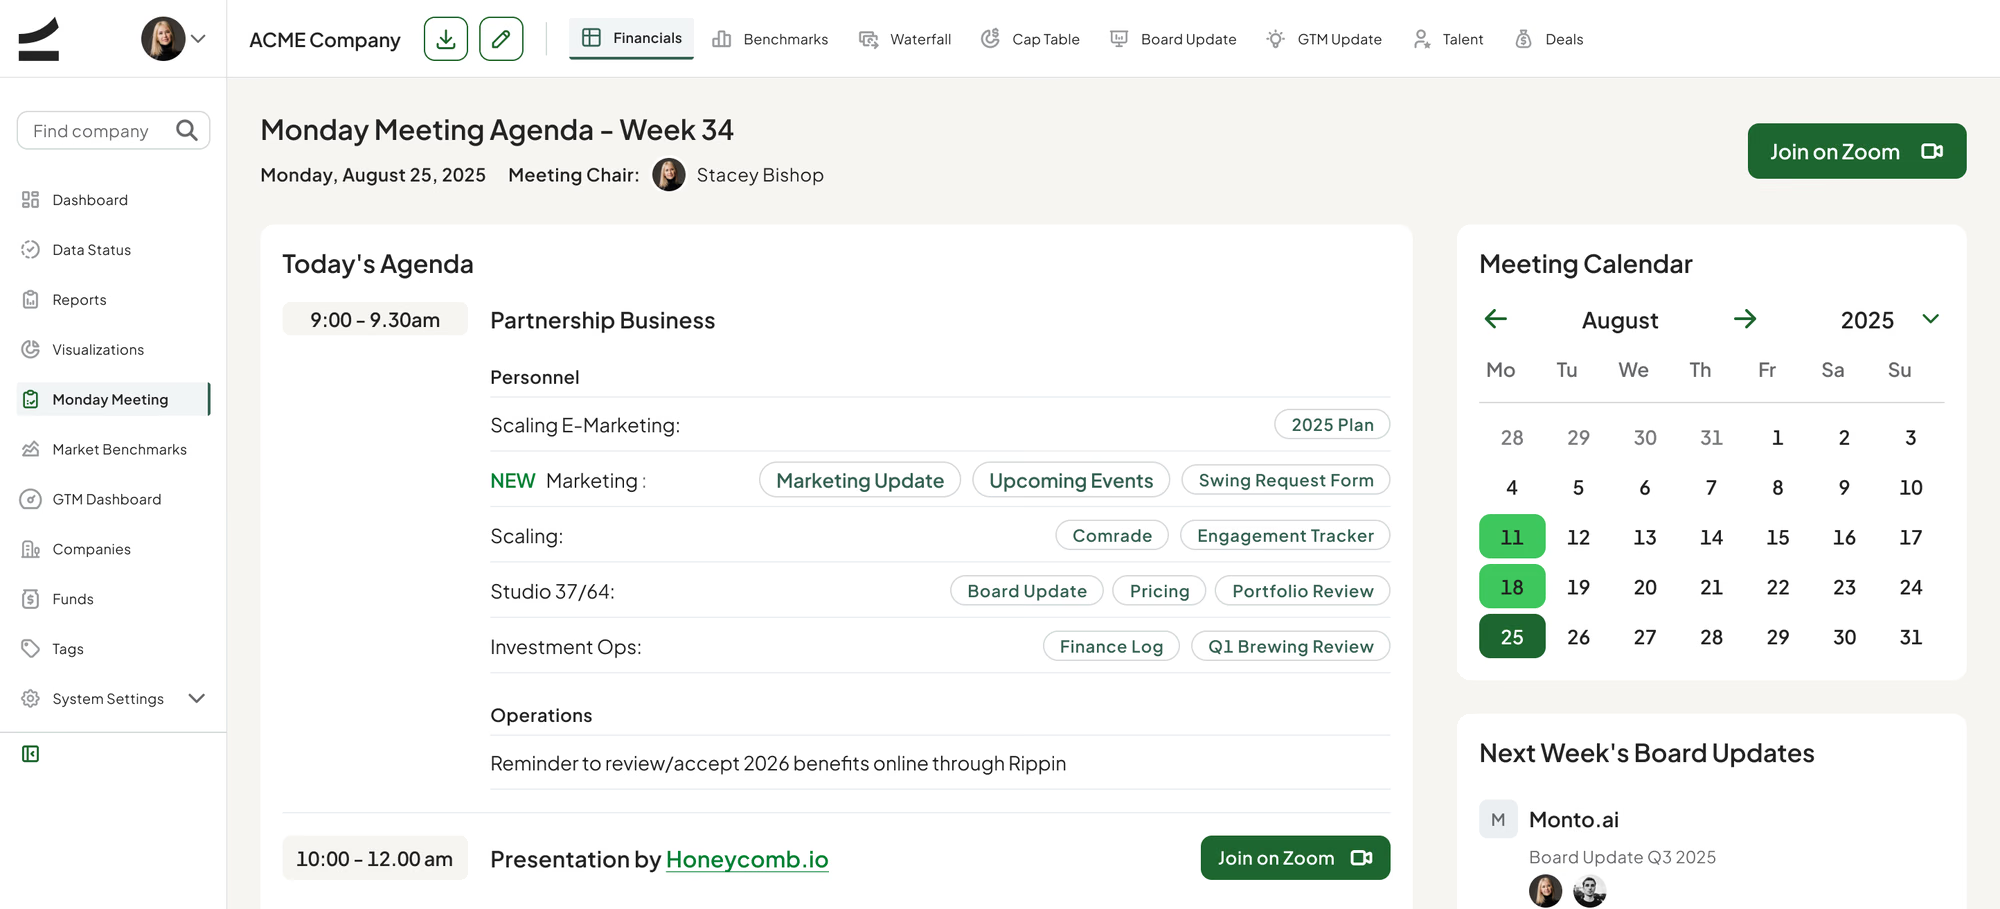
PHASE 2: Two roles reading the same data for different reasons
An Associate updates a company. An Admin reads across the whole fund. I designed both as views of one data model rather than two products, so every screen in the company layer — Financials, Cap Table, Waterfall, Board Update — has an Admin and an Associate state that differ in permissions and density, never in structure.
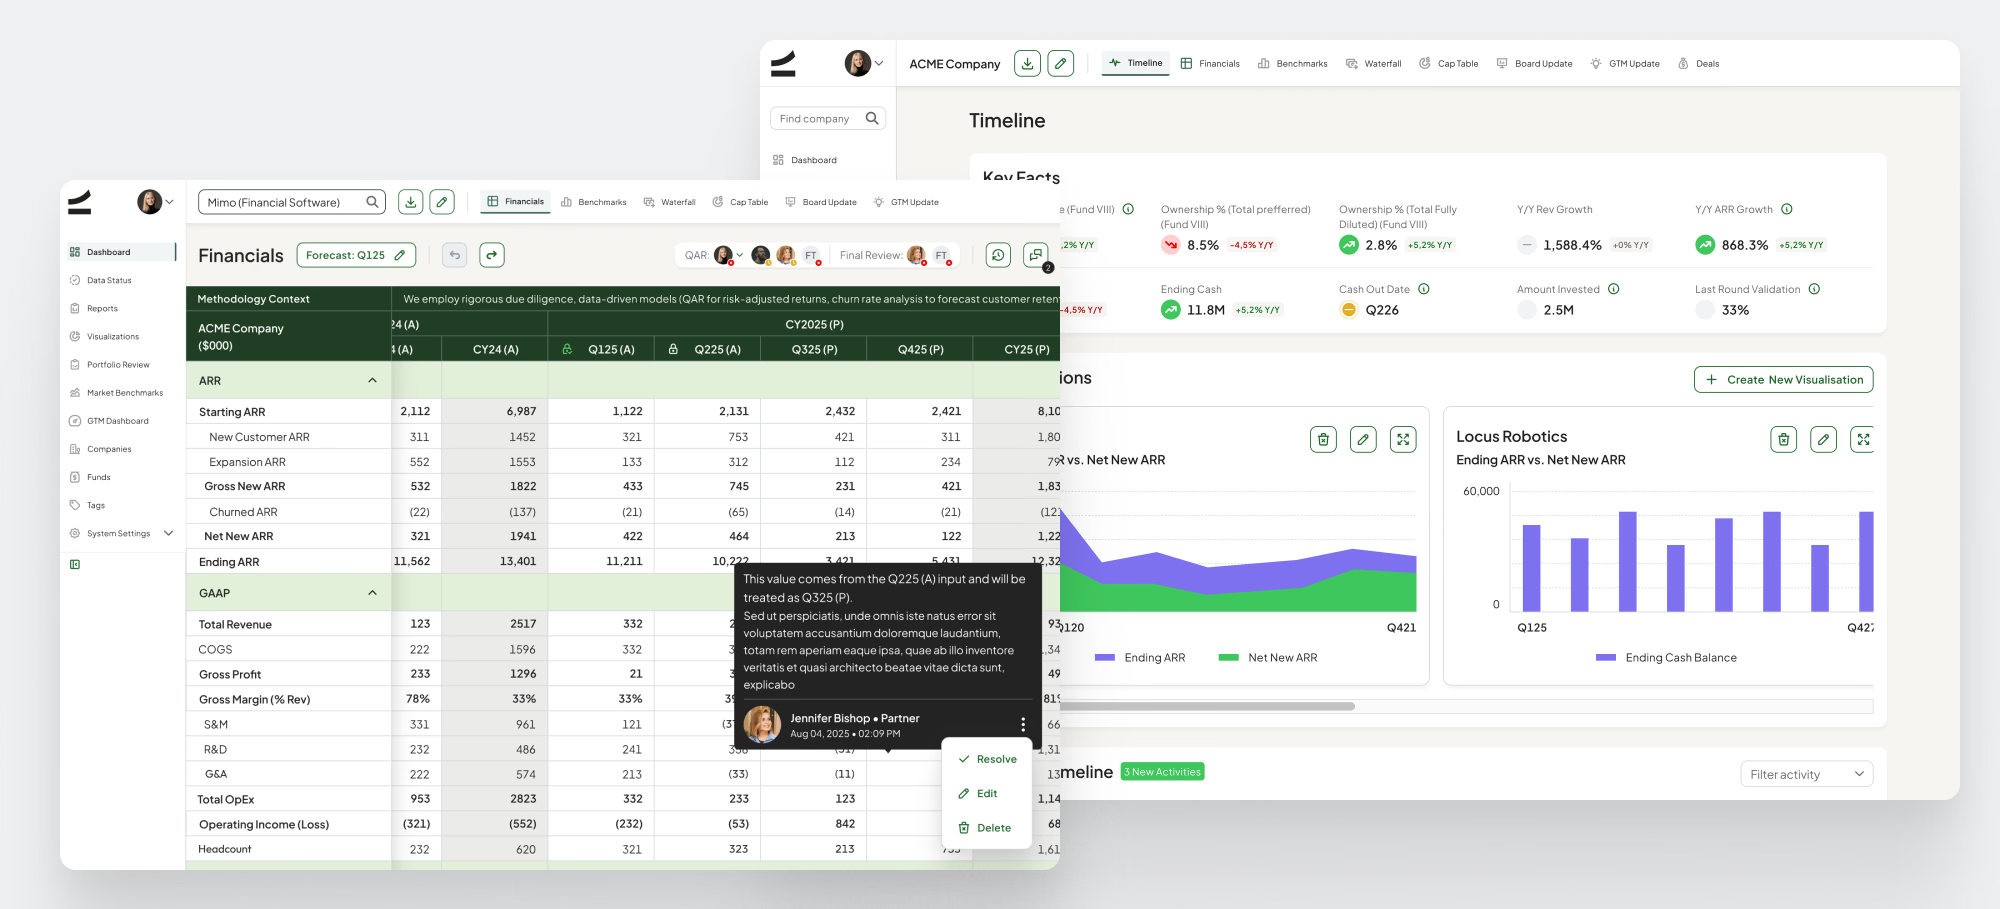
PHASE 3: Making dense financial data legible
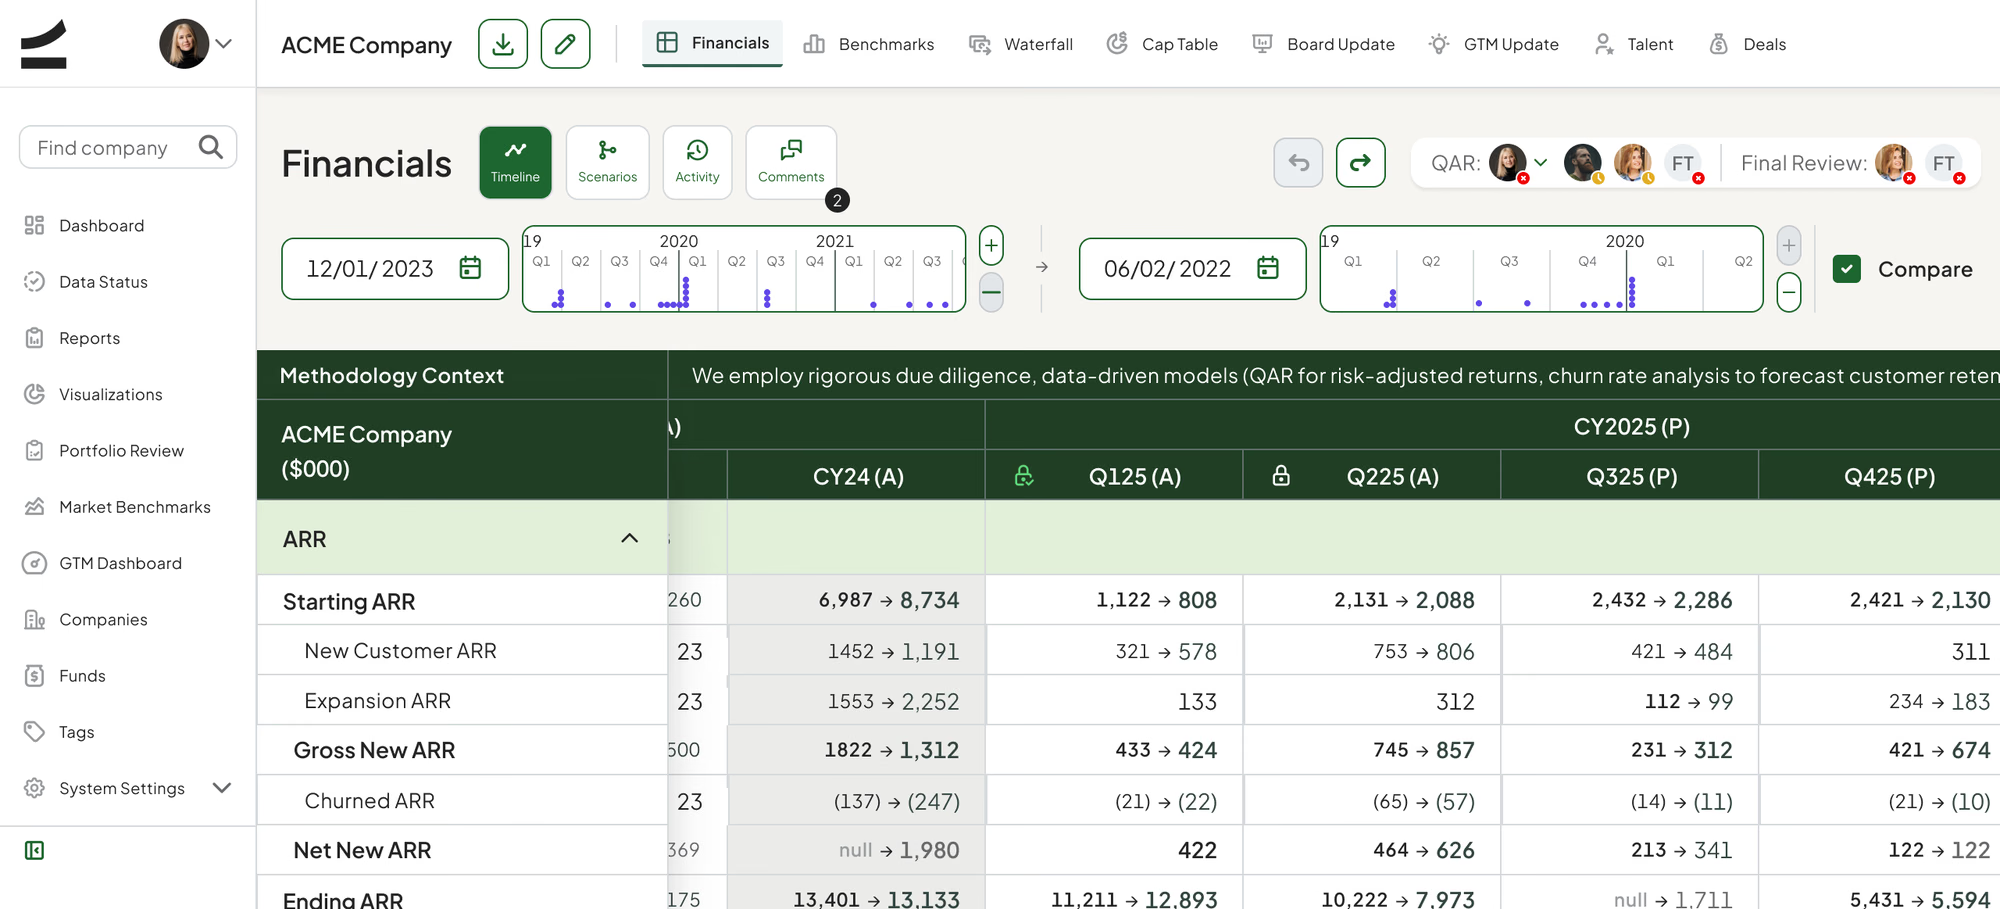
The Financials screen is a full quarterly P&L: ARR waterfall, GAAP, cash, growth, efficiency, churn, burn, OpEx ratios, balance sheet. I banded it into color-coded metric groups, kept a single frozen quarter axis across every band, and put comments inline next to the number they explain — so the reasoning lives with the figure instead of in a separate deck.
PHASE 4: A design system sized for the surface area
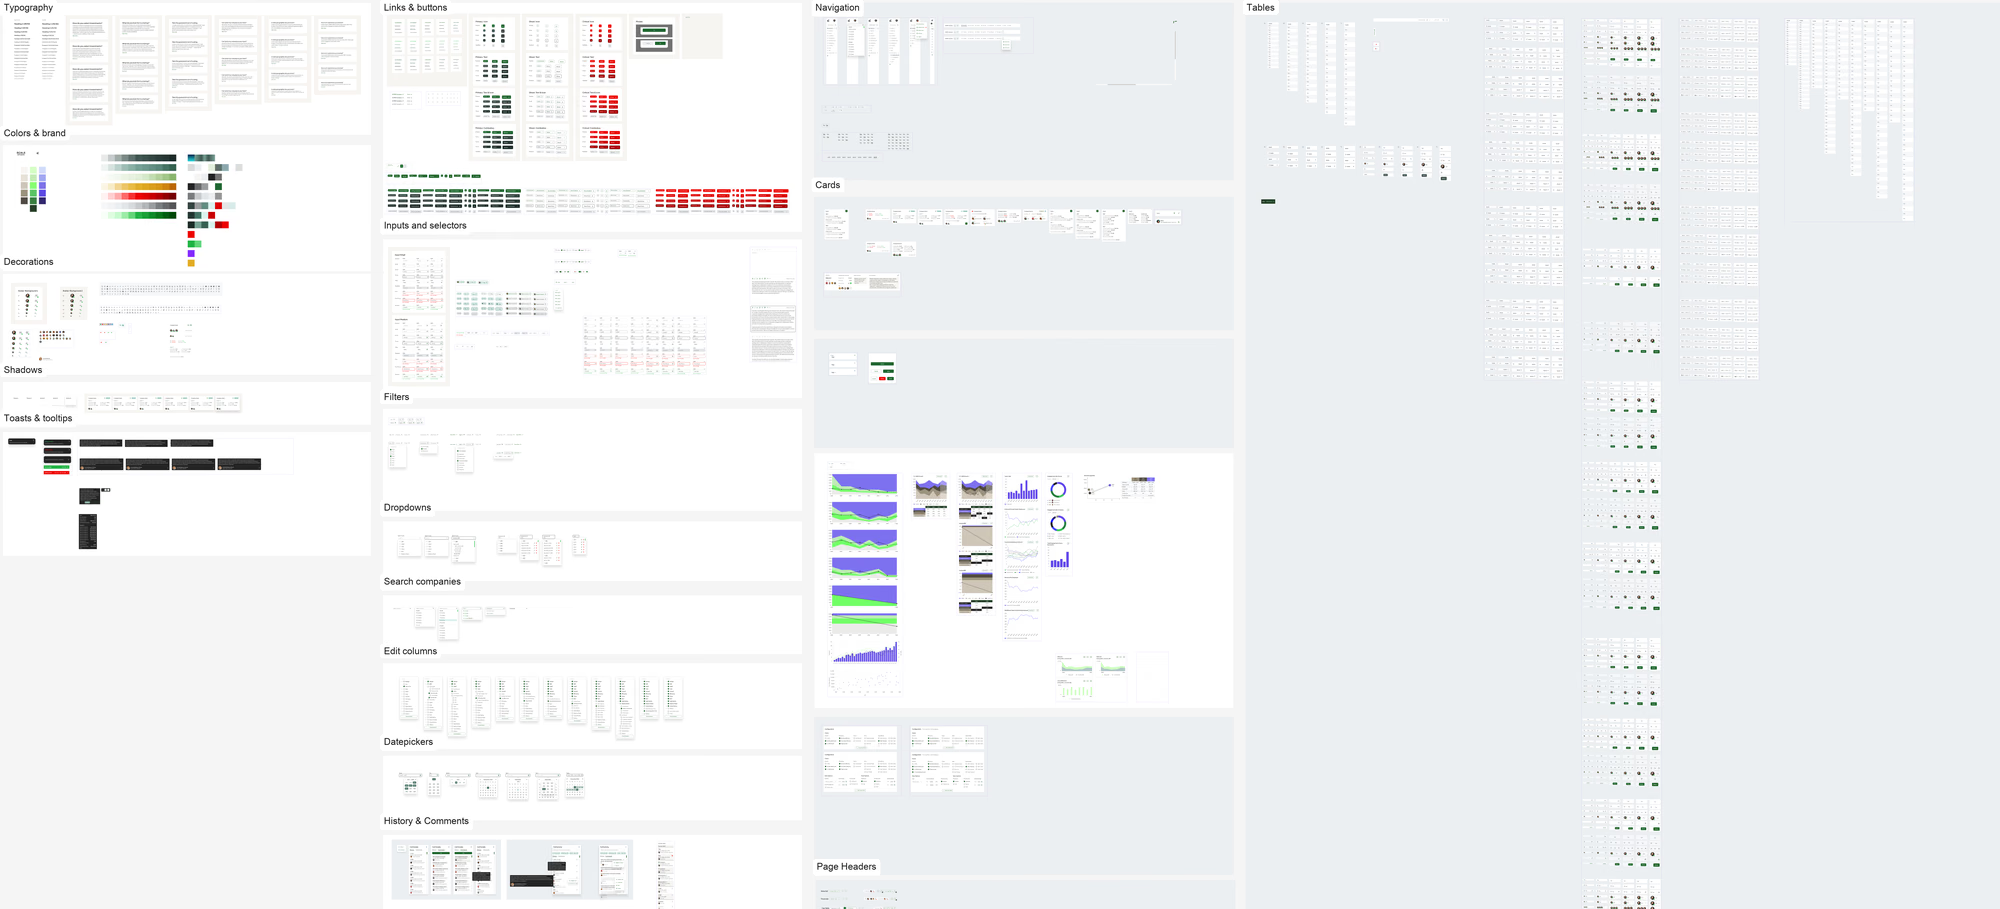
The product spans twelve top-level areas and eight company-level tabs, so consistency had to be structural. I built the library out to 2,664 components across 57 component sets, on a 23-step type scale and a 192-color palette, which let new modules ship as compositions of existing parts rather than new one-offs.
Highlights
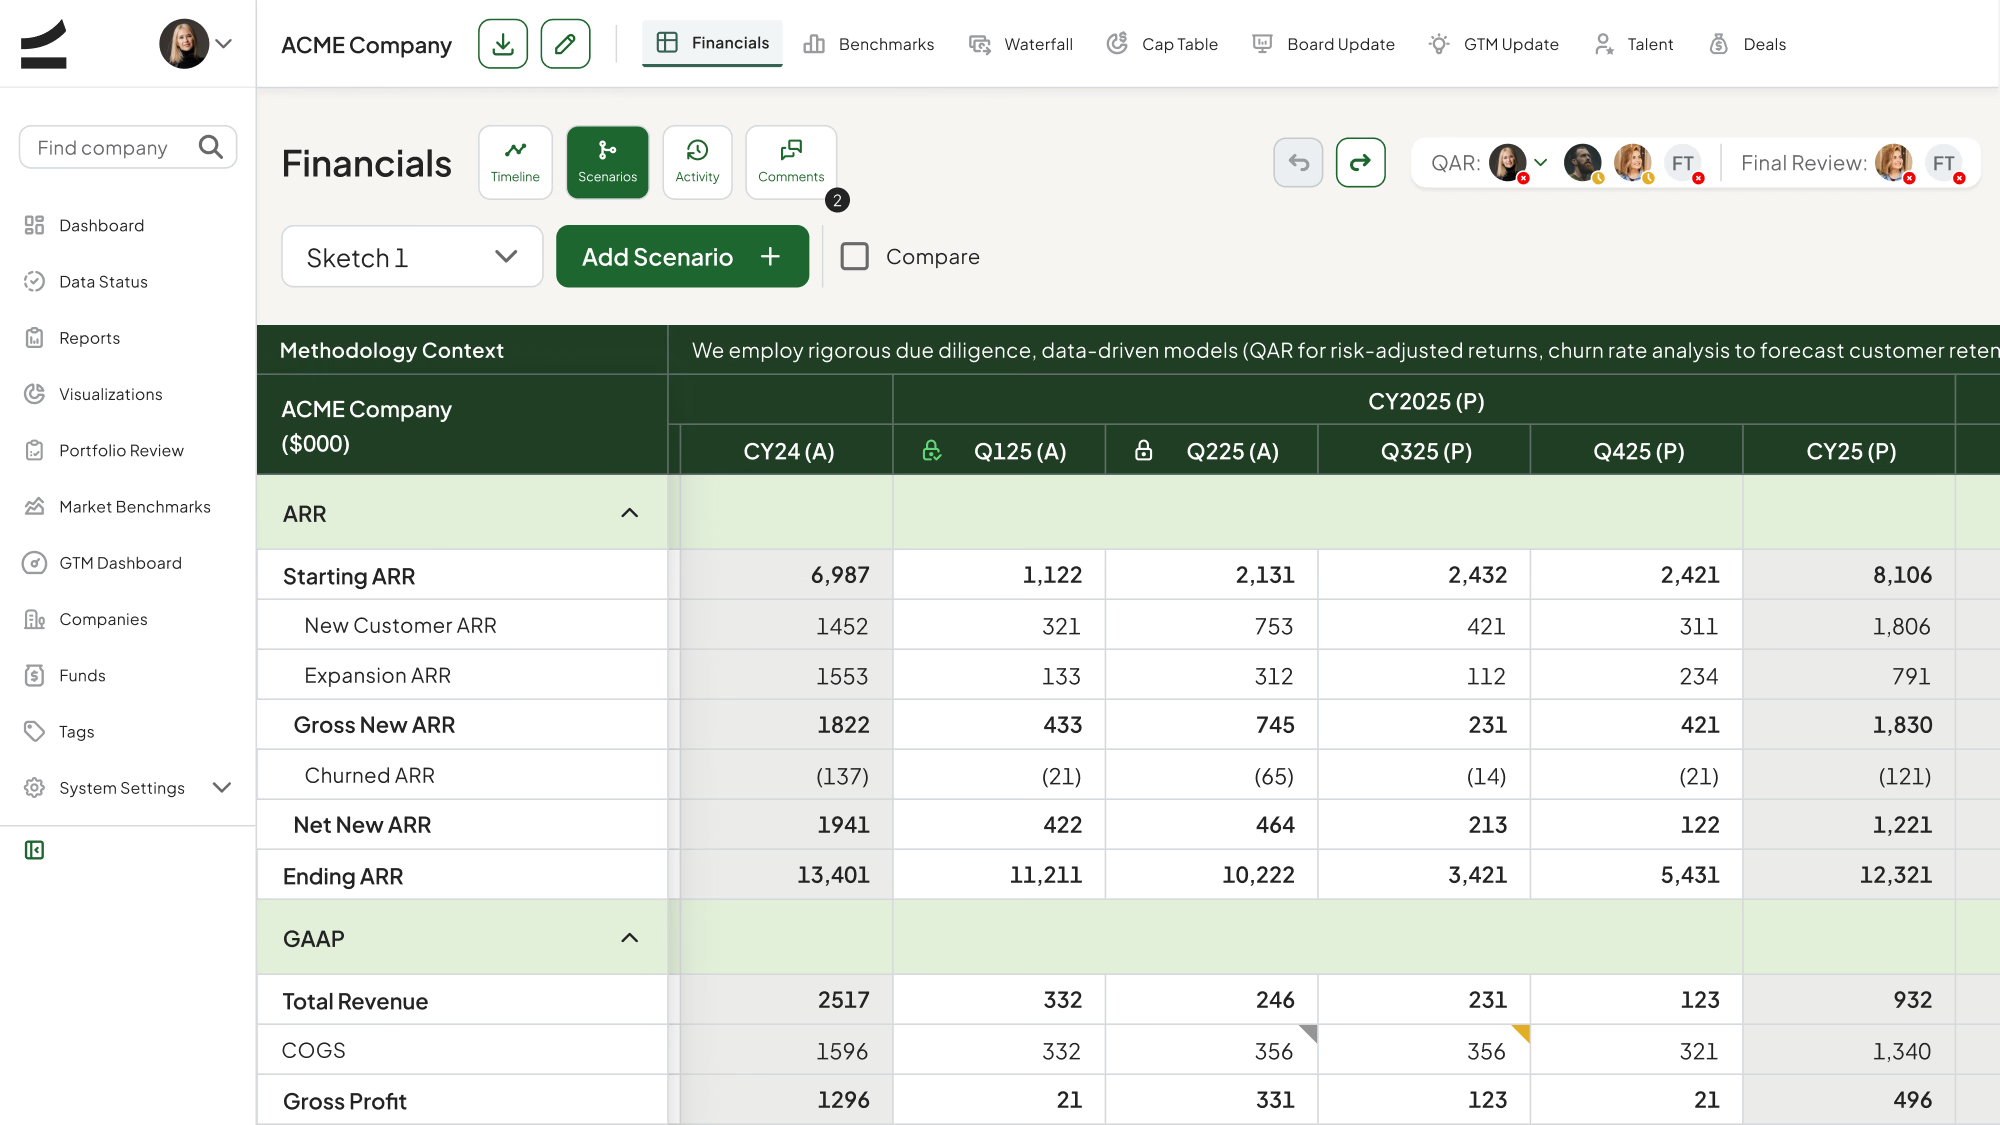
Arguing with the forecast, not about it
Analysts branch a company’s financials into named scenarios and compare them side by side, so reserve decisions rest on stated assumptions rather than one analyst’s spreadsheet.
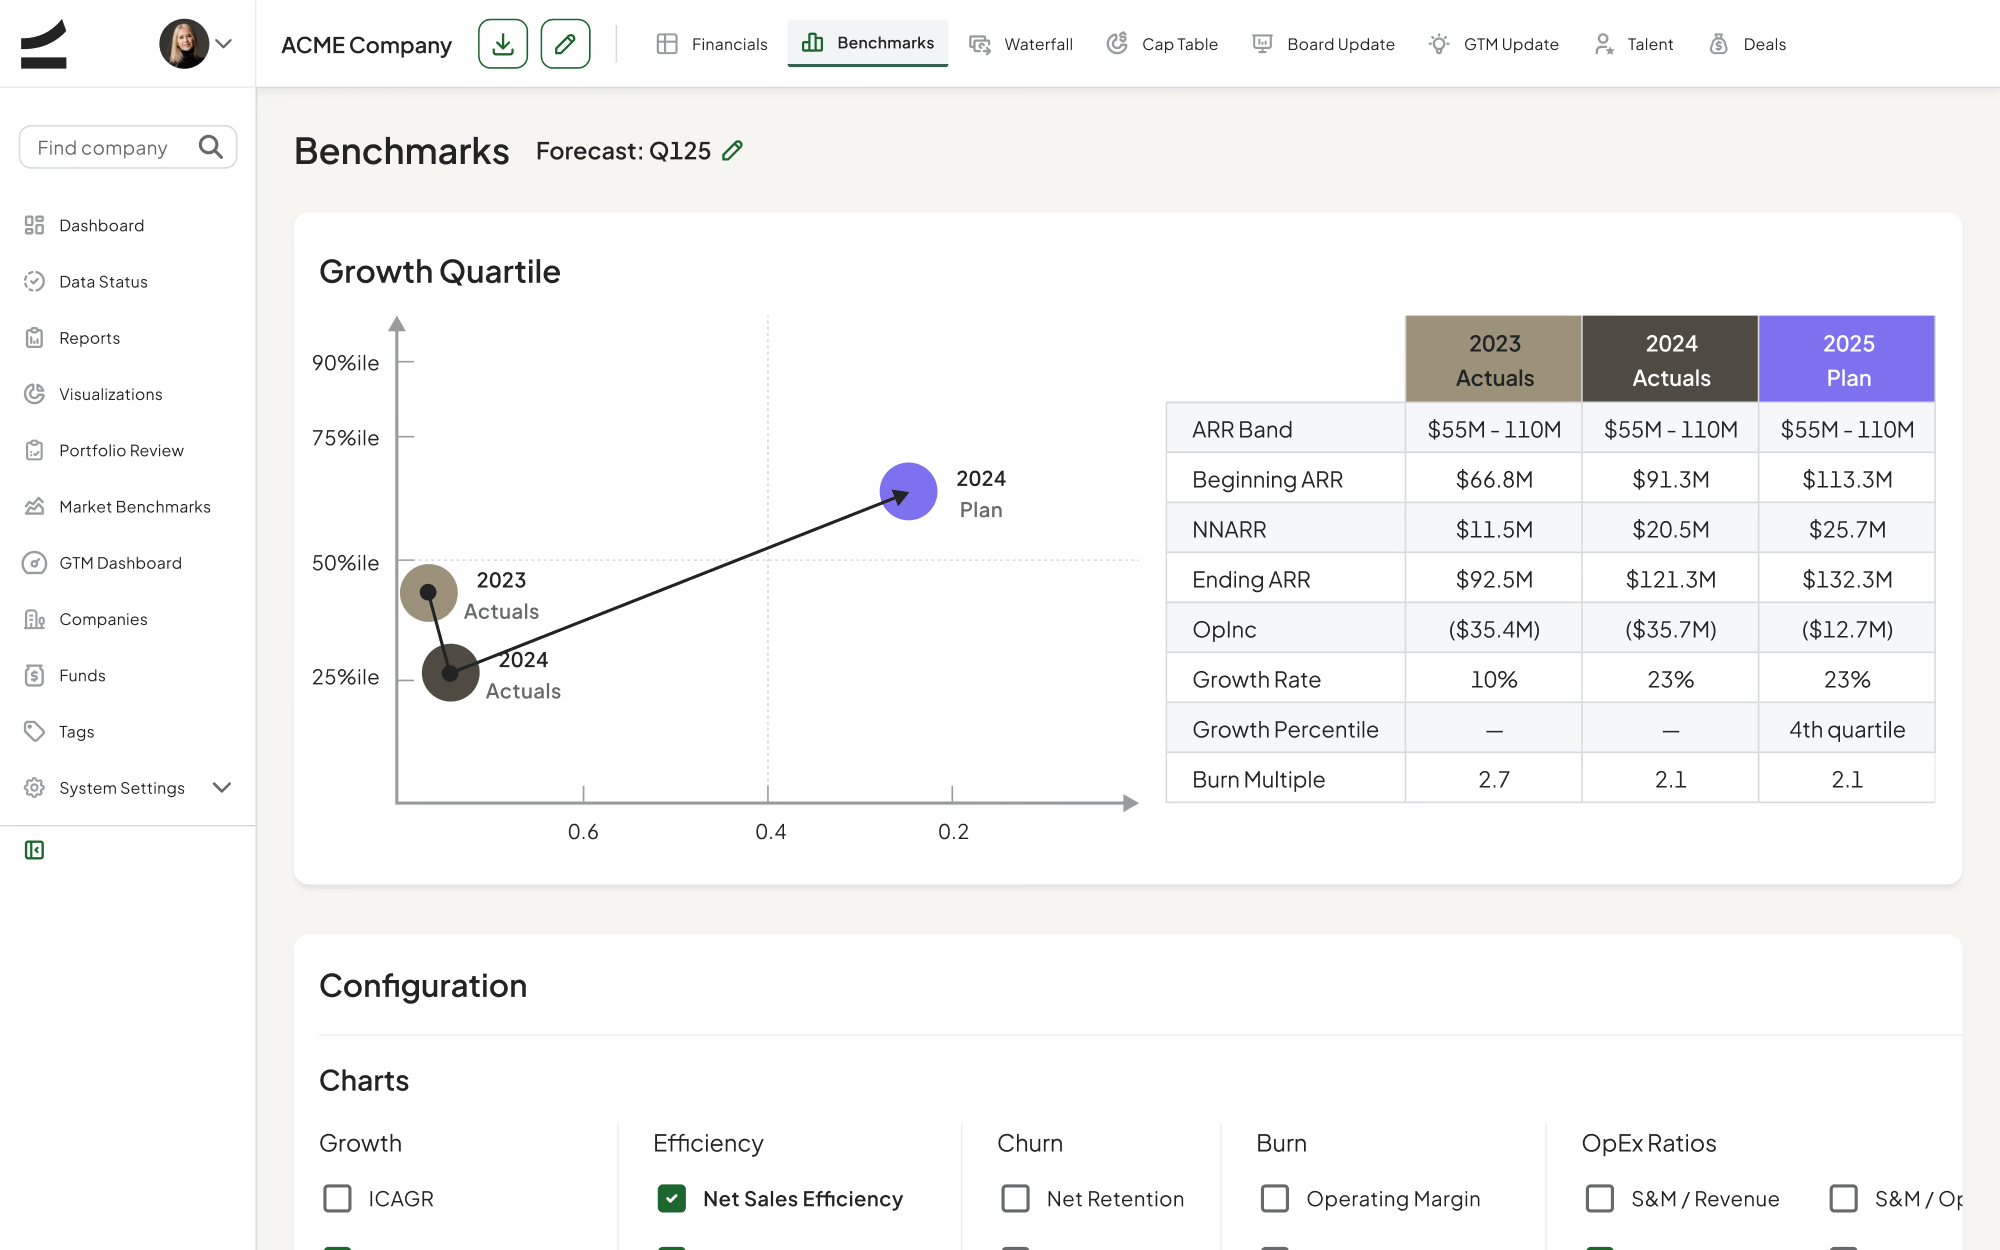
Is this good, or just growing?
Every company is scored against market quartiles — growth, burn multiple, net retention, Rule of 40 — which turns “ARR is up” into a position relative to the market.
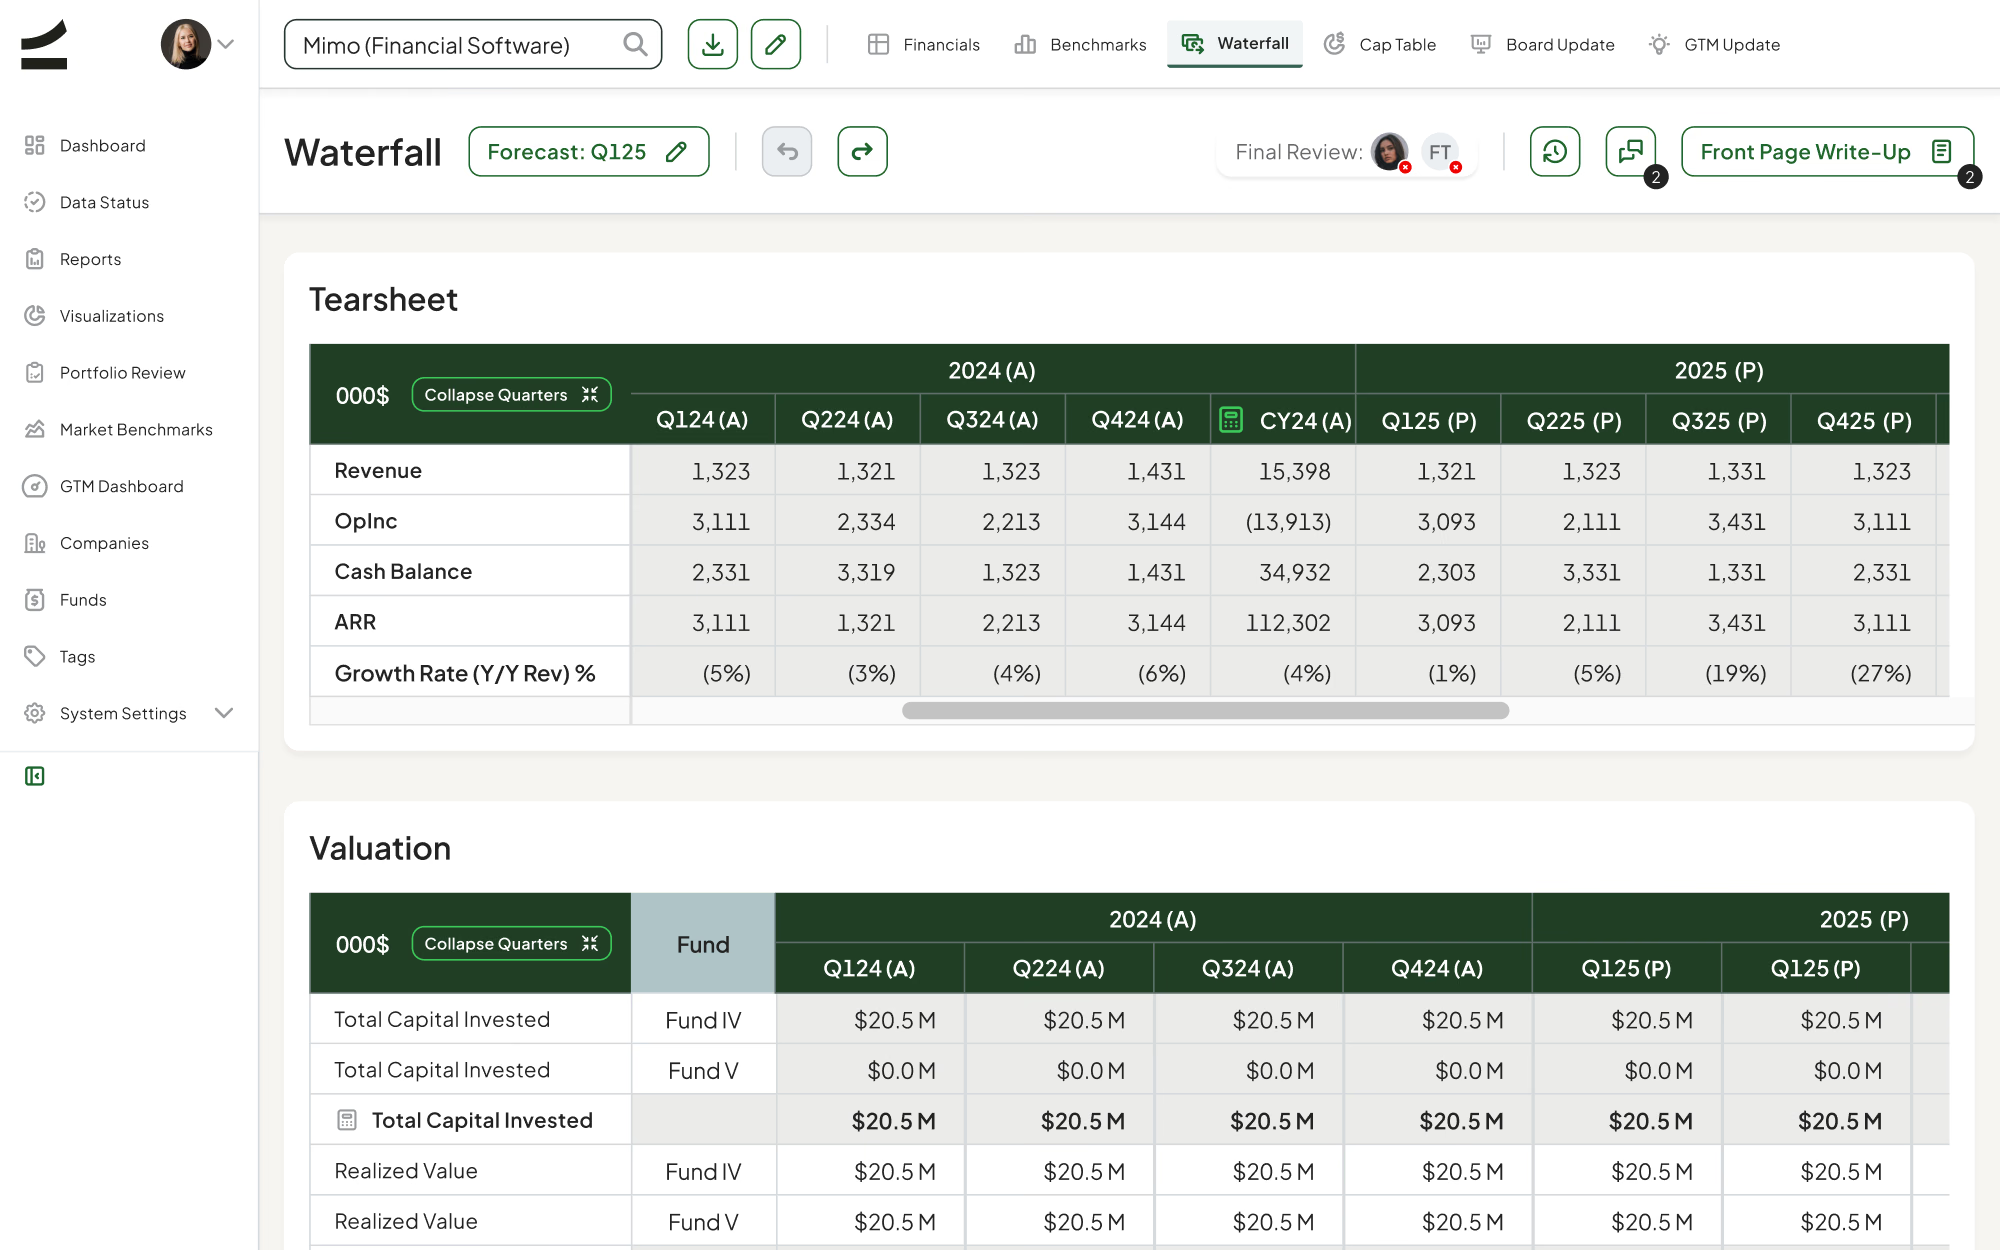
What the fund actually returns
Realized and unrealized value roll up per fund with MOIC and FMV method, so partners read the return position of a holding without rebuilding a separate model.
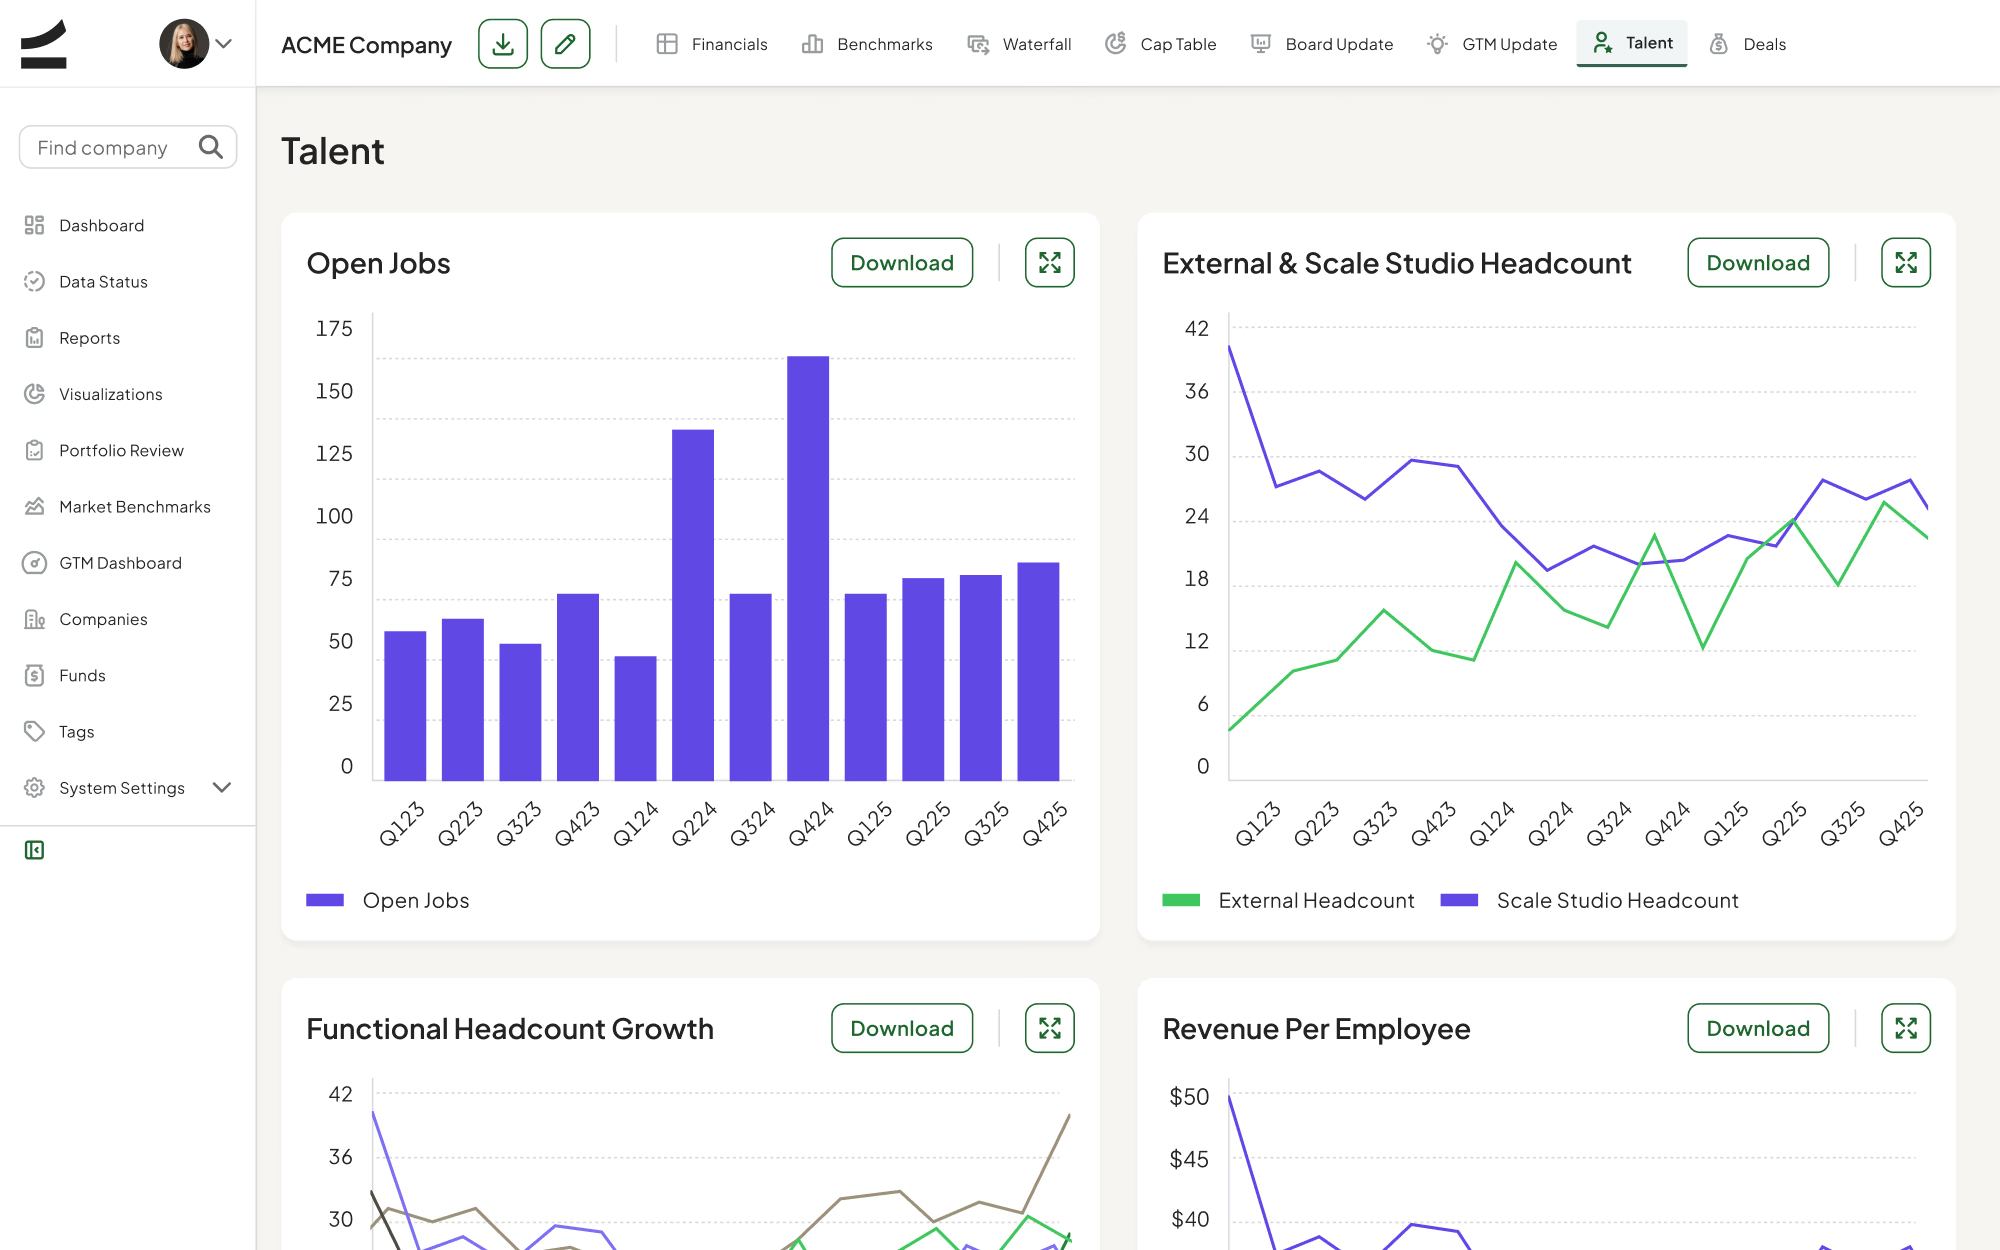
Headcount as an efficiency signal
Hiring is read against revenue per employee and new ARR per sales rep, benchmarked to quartiles, so a growing team shows up as leverage or as drag — not just as growth.
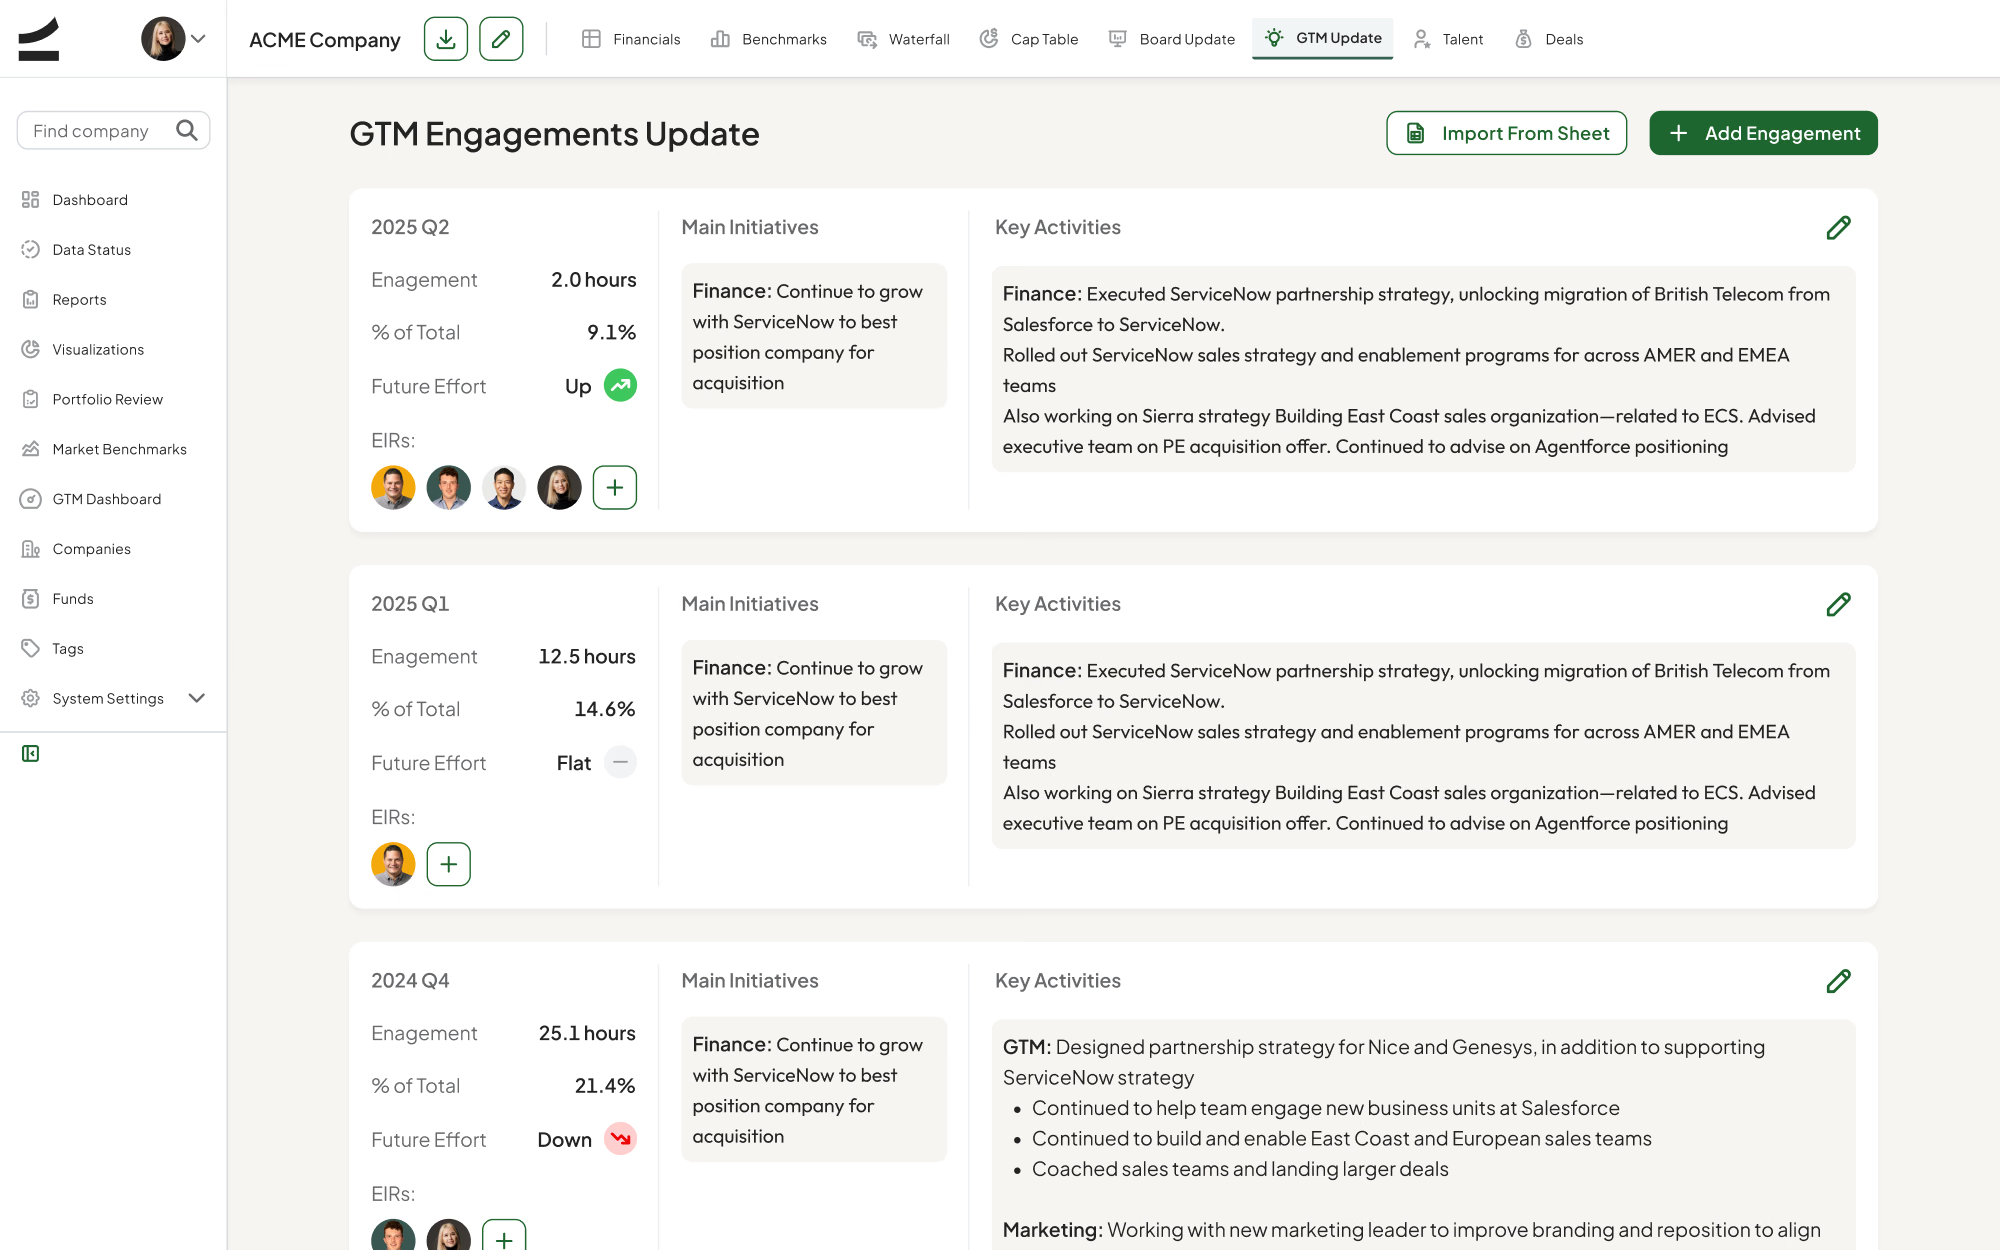
Proving the platform promise
Each engagement logs hours, initiatives, and whether effort is trending up or down, which makes “we support our founders” something the partnership can actually review.
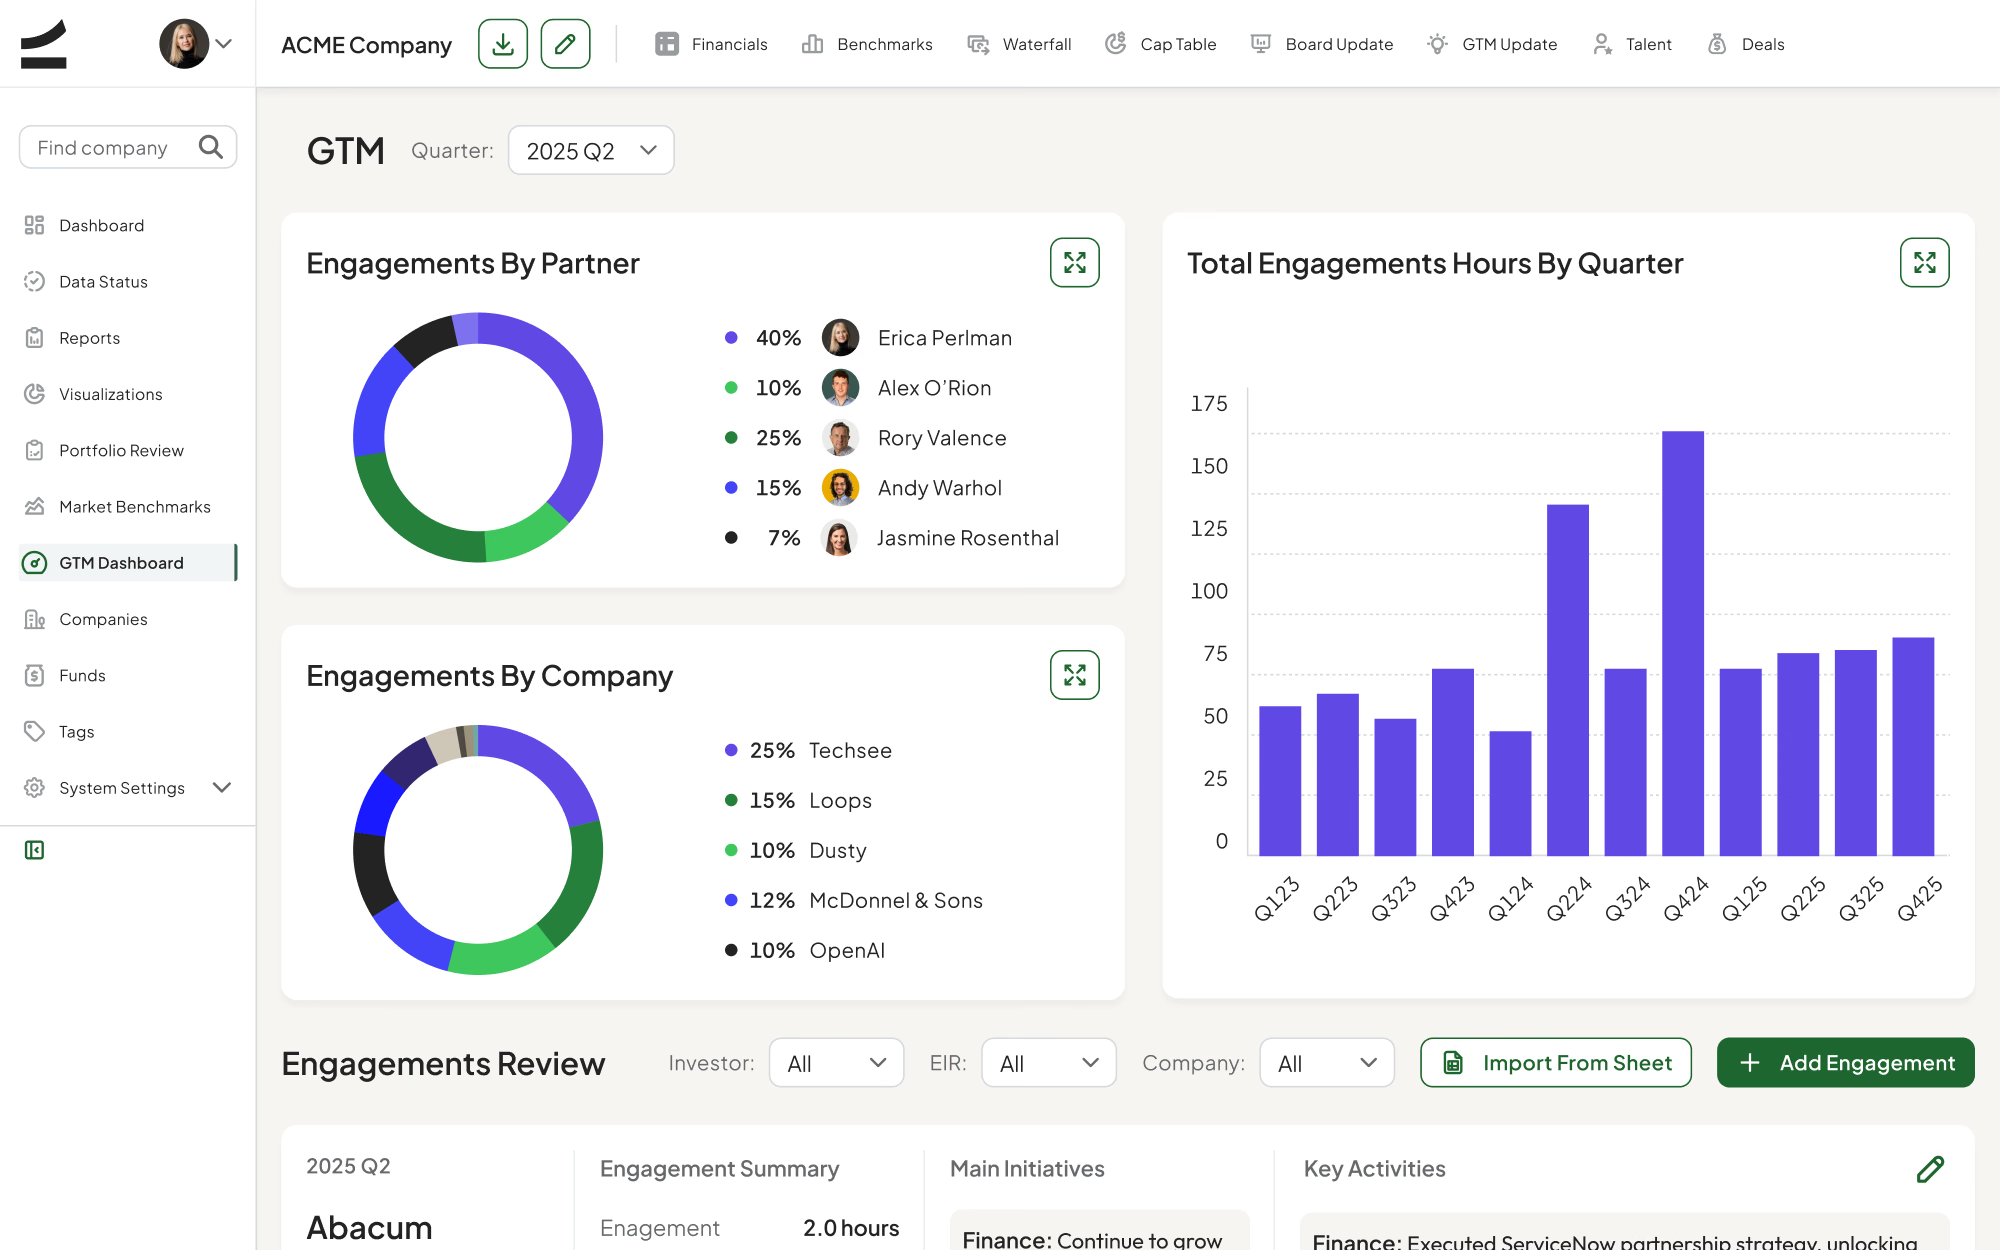
Where the platform team’s time goes
Engagement hours aggregate by partner, by company, and by quarter, so the fund can see which companies absorb its capacity and rebalance on purpose.
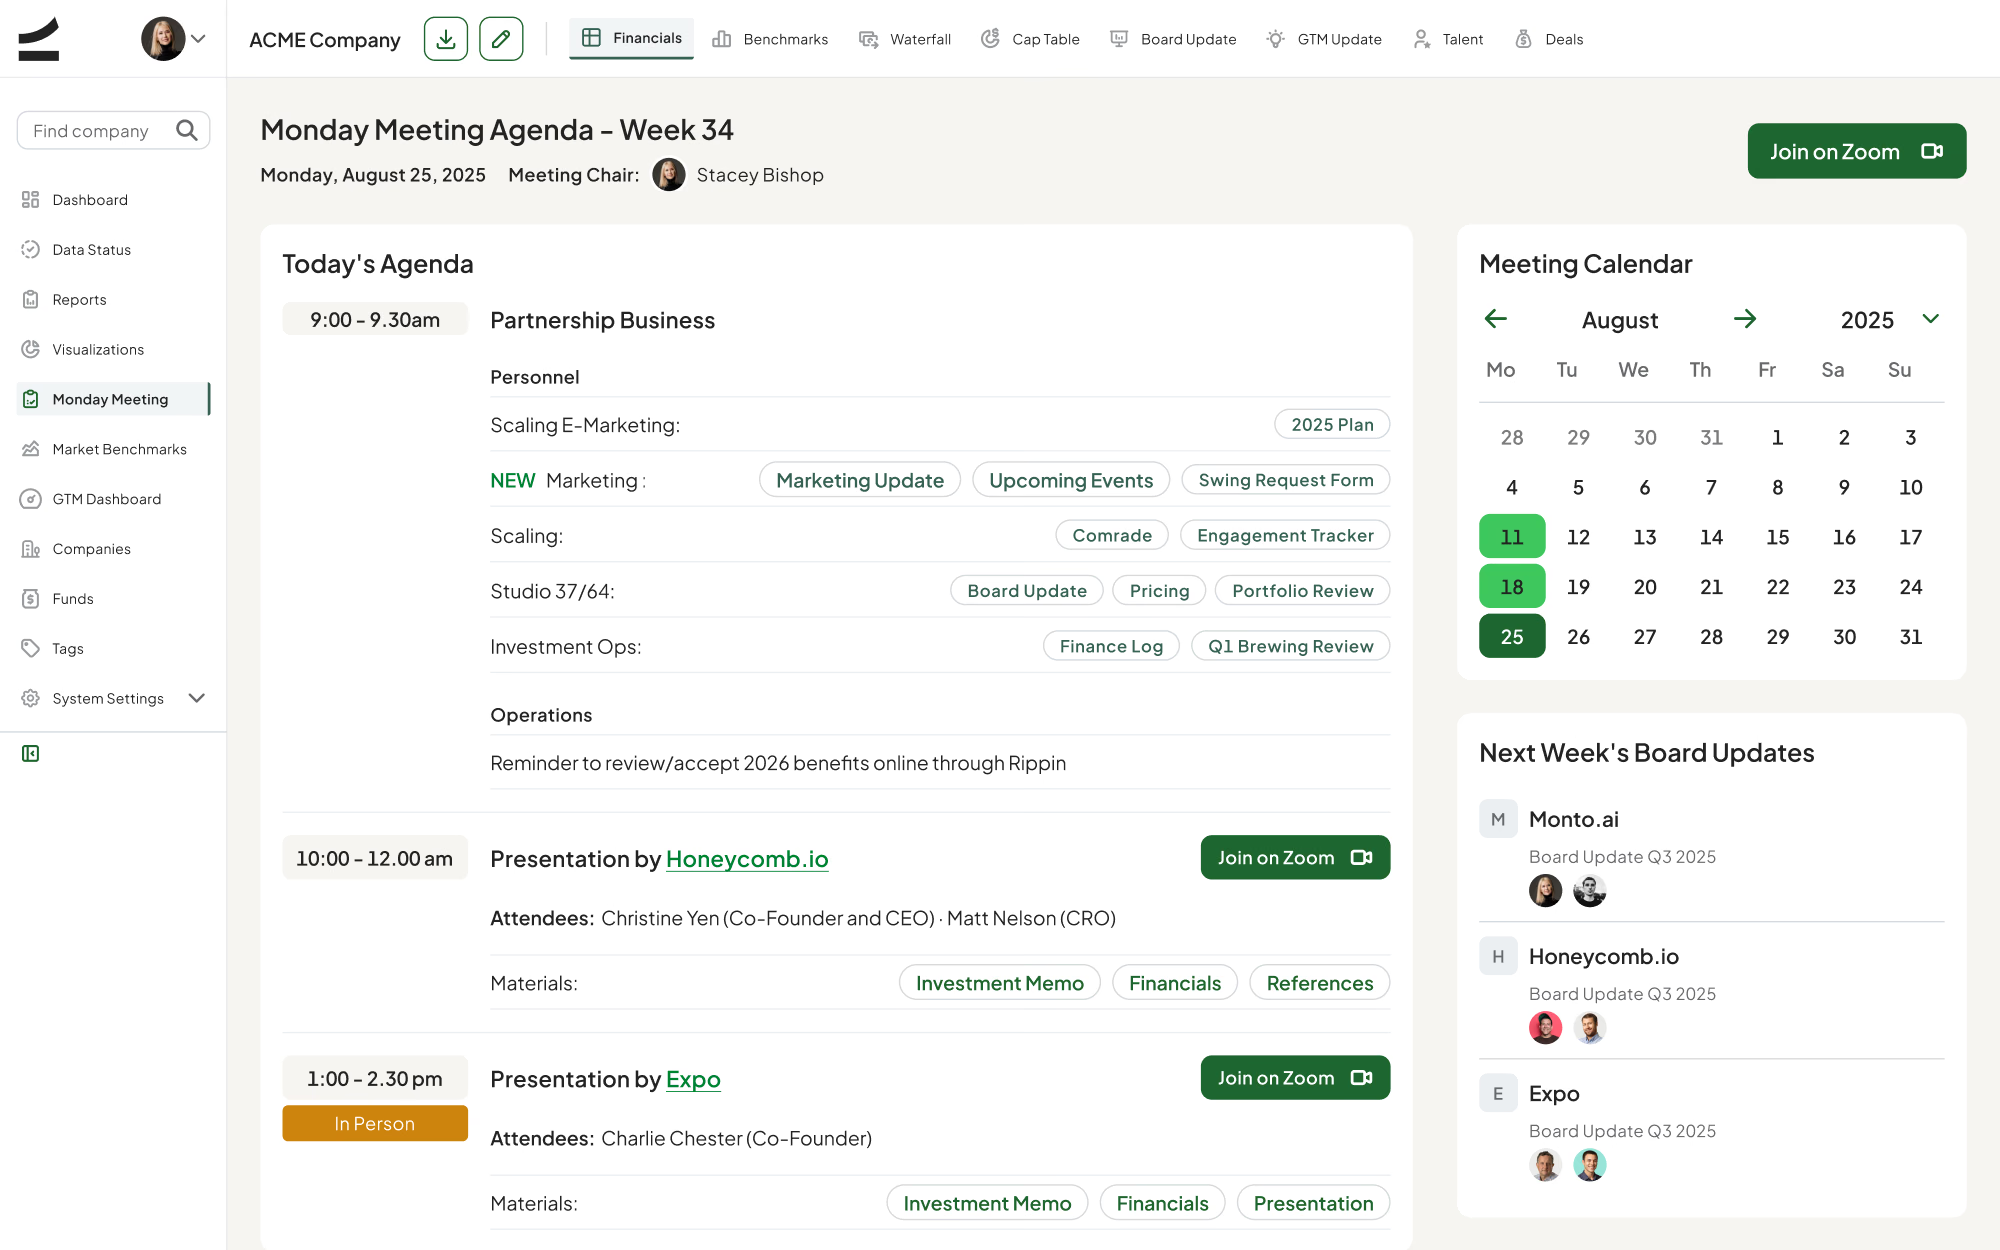
The Monday meeting runs from the product
The weekly agenda carries time blocks, founder presentations, attendees, and investment memos in one place, so the meeting stops being a deck assembled the night before.
Outcomes
One source of truth — quarterly reviews now open on live portfolio data instead of a spreadsheet rebuilt by hand the week before.
Shipped as a system — a 2,664-component library meant each new module arrived as a composition of existing parts, not a new one-off.
Two roles, one model — Admin and Associate stayed structurally identical as scope grew; permissions and density changed, structure never did.
Built for the next quarter — twelve fund-level areas and eight company-level tabs share one navigation logic, so the platform absorbed new modules without a redesign.
Scale Studio Portfolio intelligence for an early-stage VC fund
Industry
Venture Capital
My role
Lead Product Designer
Year
2025—2026
About the company
Scale Venture Partners is an early-stage venture capital firm focused on AI and B2B software, leading most of its Series A and B rounds out of a $900M fund.
Challenge
A fund that leads eighty percent of its checks lives or dies by how fast it can read its own portfolio. At Scale Venture Partners that picture was scattered across spreadsheets, board decks, and inboxes, so every quarterly review started by rebuilding the same numbers by hand. They needed one place where financials, cap tables, and return models stayed current between meetings — not only right before them.
PHASE 1: I designed around the fund’s calendar, not its org chart
I started from the rhythm the firm already ran on — the quarterly close, the Monday meeting, the board update — and mapped which numbers each ritual needed and who touched them first. That sequence became the information architecture. Dashboard, Data Status, Portfolio Review and Monday Meeting Agenda are not modules; they are the four moments in a quarter.
PHASE 2: Two roles reading the same data for different reasons
An Associate updates a company. An Admin reads across the whole fund. I designed both as views of one data model rather than two products, so every screen in the company layer — Financials, Cap Table, Waterfall, Board Update — has an Admin and an Associate state that differ in permissions and density, never in structure.
PHASE 3: Making dense financial data legible
The Financials screen is a full quarterly P&L: ARR waterfall, GAAP, cash, growth, efficiency, churn, burn, OpEx ratios, balance sheet. I banded it into color-coded metric groups, kept a single frozen quarter axis across every band, and put comments inline next to the number they explain — so the reasoning lives with the figure instead of in a separate deck.
PHASE 4: A design system sized for the surface area
The product spans twelve top-level areas and eight company-level tabs, so consistency had to be structural. I built the library out to 2,664 components across 57 component sets, on a 23-step type scale and a 192-color palette, which let new modules ship as compositions of existing parts rather than new one-offs.
Highlights
Arguing with the forecast, not about it
Analysts branch a company’s financials into named scenarios and compare them side by side, so reserve decisions rest on stated assumptions rather than one analyst’s spreadsheet.
Is this good, or just growing?
Every company is scored against market quartiles — growth, burn multiple, net retention, Rule of 40 — which turns “ARR is up” into a position relative to the market.
What the fund actually returns
Realized and unrealized value roll up per fund with MOIC and FMV method, so partners read the return position of a holding without rebuilding a separate model.
Headcount as an efficiency signal
Hiring is read against revenue per employee and new ARR per sales rep, benchmarked to quartiles, so a growing team shows up as leverage or as drag — not just as growth.
Proving the platform promise
Each engagement logs hours, initiatives, and whether effort is trending up or down, which makes “we support our founders” something the partnership can actually review.
Where the platform team’s time goes
Engagement hours aggregate by partner, by company, and by quarter, so the fund can see which companies absorb its capacity and rebalance on purpose.
The Monday meeting runs from the product
The weekly agenda carries time blocks, founder presentations, attendees, and investment memos in one place, so the meeting stops being a deck assembled the night before.
Outcomes
One source of truth — quarterly reviews now open on live portfolio data instead of a spreadsheet rebuilt by hand the week before.
Shipped as a system — a 2,664-component library meant each new module arrived as a composition of existing parts, not a new one-off.
Two roles, one model — Admin and Associate stayed structurally identical as scope grew; permissions and density changed, structure never did.
Built for the next quarter — twelve fund-level areas and eight company-level tabs share one navigation logic, so the platform absorbed new modules without a redesign.